29
/
en
AIzaSyAYiBZKx7MnpbEhh9jyipgxe19OcubqV5w
April 1, 2024
68918
Antigua and Barbuda
ATG
true
2
1
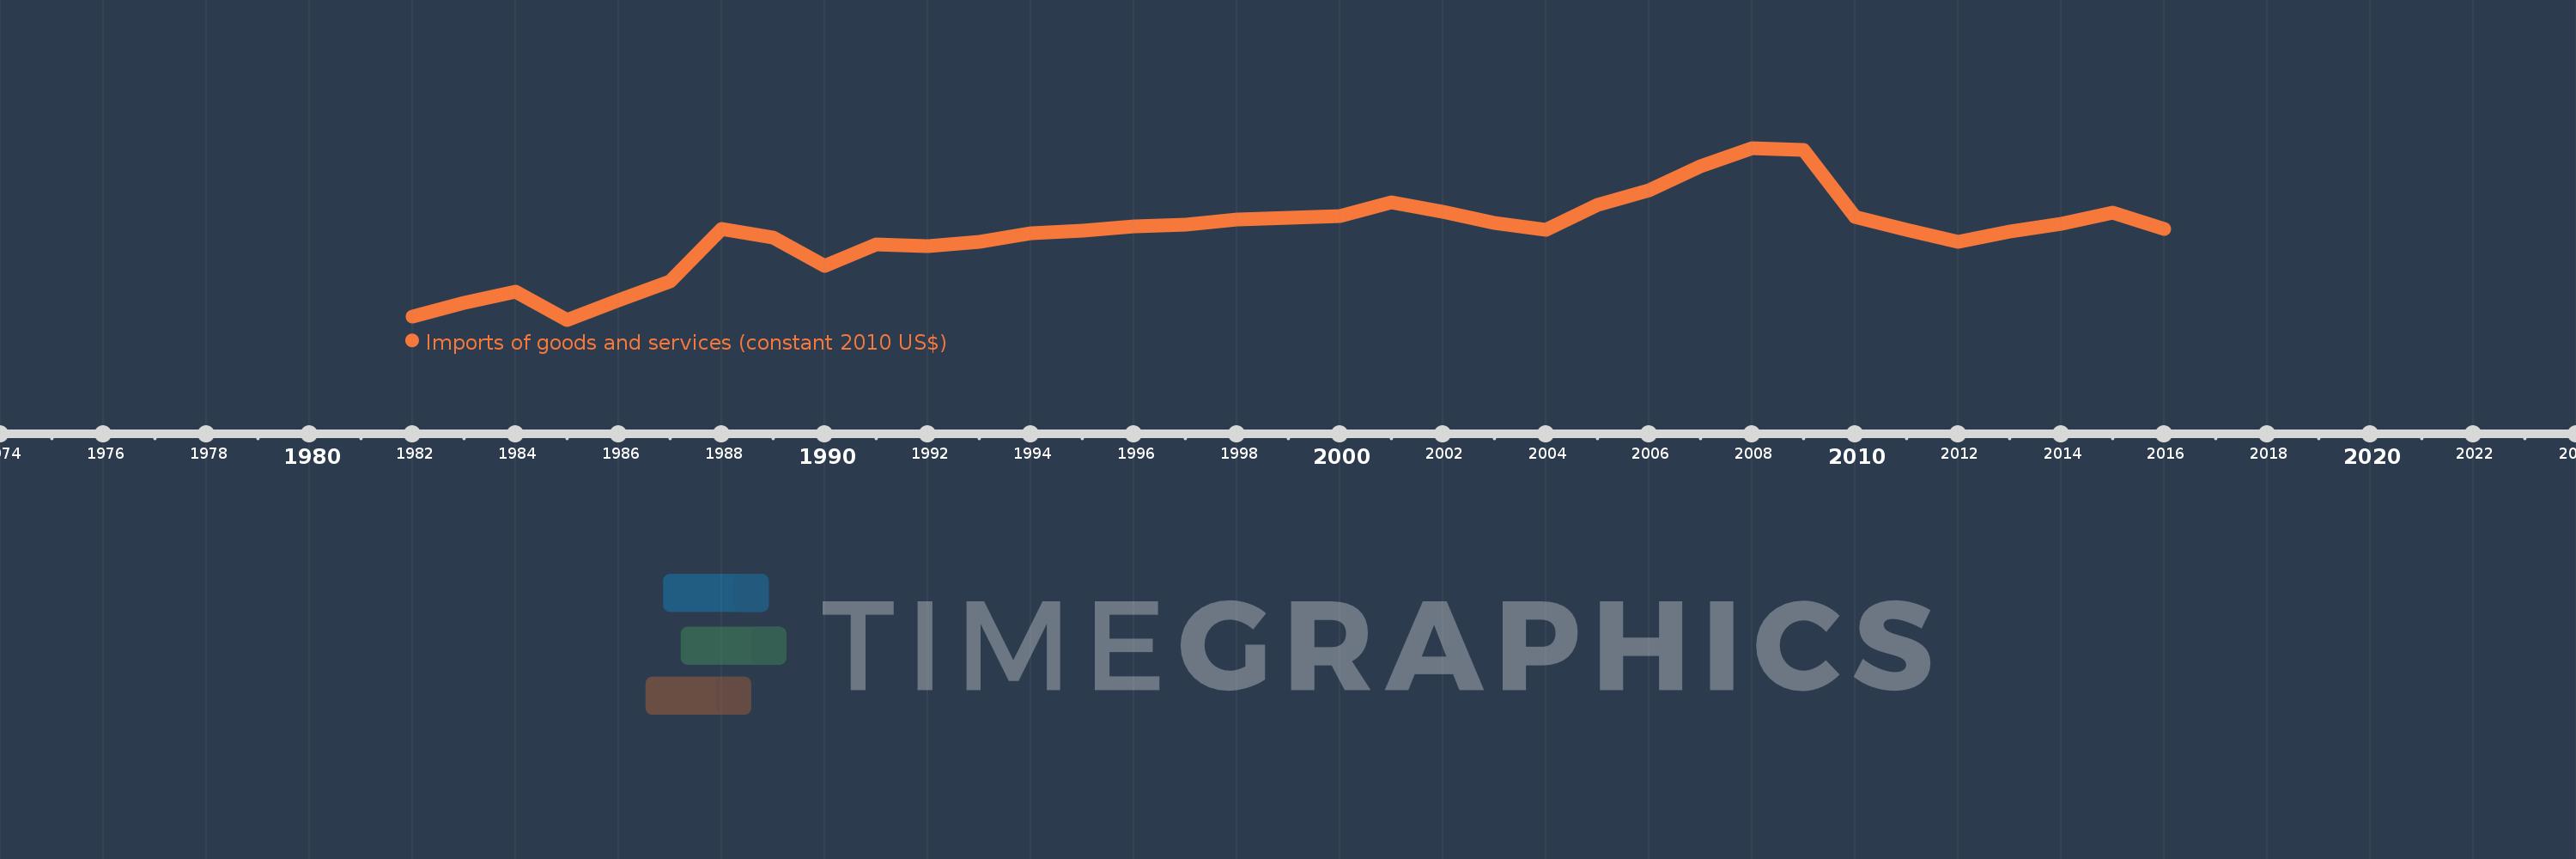
Imports of goods and services (constant 2010 US$)
2016,2015,2014,2013,2012,2011,2010,2009,2008,2007,2006,2005,2004,2003,2002,2001,2000,1999,1998,1997,1996,1995,1994,1993,1992,1991,1990,1989,1988,1987,1986,1985,1984,1983,1982
This statistics in other country:
AfghanistanAlbaniaAlgeriaAngolaAntigua and BarbudaArab WorldArgentinaArmeniaArubaAustraliaAustriaAzerbaijanBahamas, TheBahrainBangladeshBarbadosBelarusBelgiumBelizeBeninBermudaBhutanBoliviaBosnia and HerzegovinaBotswanaBrazilBrunei DarussalamBulgariaBurkina FasoBurundiCabo VerdeCambodiaCameroonCanadaCaribbean small statesCentral African RepublicCentral Europe and the BalticsChadChileChinaColombiaComorosCongo, Dem. Rep.Congo, Rep.Costa RicaCote d'IvoireCroatiaCubaCyprusCzech RepublicDenmarkDominicaDominican RepublicEarly-demographic dividendEast Asia & PacificEast Asia & Pacific (excluding high income)East Asia & Pacific (IDA & IBRD countries)EcuadorEgypt, Arab Rep.El SalvadorEquatorial GuineaEritreaEstoniaEuro areaEurope & Central AsiaEurope & Central Asia (excluding high income)Europe & Central Asia (IDA & IBRD countries)European UnionFaroe IslandsFijiFinlandFragile and conflict affected situationsFranceGabonGambia, TheGeorgiaGermanyGhanaGreeceGrenadaGuatemalaGuineaGuinea-BissauGuyanaHaitiHeavily indebted poor countries (HIPC)High incomeHondurasHong Kong SAR, ChinaHungaryIBRD onlyIcelandIDA & IBRD totalIDA blendIDA onlyIDA totalIndiaIndonesiaIran, Islamic Rep.IraqIrelandIsraelItalyJamaicaJapanJordanKazakhstanKenyaKiribatiKorea, Rep.KosovoKuwaitKyrgyz RepublicLao PDRLate-demographic dividendLatin America & Caribbean Latin America & Caribbean (excluding high income)Latin America & the Caribbean (IDA & IBRD countries)LatviaLeast developed countries: UN classificationLebanonLiberiaLibyaLithuaniaLow & middle incomeLow incomeLower middle incomeLuxembourgMacao SAR, ChinaMacedonia, FYRMadagascarMalawiMalaysiaMaldivesMaliMaltaMauritaniaMauritiusMexicoMiddle East & North AfricaMiddle East & North Africa (excluding high income)Middle East & North Africa (IDA & IBRD countries)Middle incomeMoldovaMongoliaMontenegroMoroccoMozambiqueMyanmarNamibiaNepalNetherlandsNew ZealandNicaraguaNigerNigeriaNorth AmericaNorwayOECD membersOmanOther small statesPacific island small statesPakistanPalauPanamaParaguayPeruPhilippinesPolandPortugalPost-demographic dividendPre-demographic dividendPuerto RicoQatarRomaniaRussian FederationRwandaSamoaSaudi ArabiaSenegalSerbiaSeychellesSierra LeoneSingaporeSlovak RepublicSloveniaSmall statesSolomon IslandsSouth AfricaSouth AsiaSouth Asia (IDA & IBRD)South SudanSpainSri LankaSt. Kitts and NevisSt. LuciaSt. Vincent and the GrenadinesSub-Saharan Africa Sub-Saharan Africa (excluding high income)Sub-Saharan Africa (IDA & IBRD countries)SudanSurinameSwazilandSwedenSwitzerlandTajikistanTanzaniaThailandTimor-LesteTogoTongaTrinidad and TobagoTunisiaTurkeyTurkmenistanUgandaUkraineUnited Arab EmiratesUnited KingdomUnited StatesUpper middle incomeUruguayUzbekistanVanuatuVenezuela, RBVietnamWest Bank and GazaWorldYemen, Rep.ZambiaZimbabwe Timeline:
This timeline shows a graph from 1982 to 2016 of Antigua and Barbuda. No data until 1981. Number of actual observations by date: 35.
Source name:
World Development Indicators
Source organization:
World Bank national accounts data, and OECD National Accounts data files.
Categories, topics:
Economy & Growth, Trade
Last updated:
apr 23, 2017
Indicators value changes by year
Minimum:
338.531 mln
jan 1, 1985
Maximum:
989.701 mln
jan 1, 2008
At the date of observation
Value
Absolute change
Change from previous value
jan 1, 1982
351.184 mln
+351.184 mln
0.0%
jan 1, 1983
402.279 mln
+51.095 mln
14.55%
jan 1, 1984
445.231 mln
+42.952 mln
10.68%
jan 1, 1985
338.531 mln
-106.7 mln
-23.97%
jan 1, 1986
411.049 mln
+72.517 mln
21.42%
jan 1, 1987
485.095 mln
+74.046 mln
18.01%
jan 1, 1988
682.714 mln
+197.619 mln
40.74%
jan 1, 1989
650.887 mln
-31.827 mln
-4.66%
jan 1, 1990
543.328 mln
-107.558 mln
-16.52%
jan 1, 1991
625.377 mln
+82.049 mln
15.1%
jan 1, 1992
616.731 mln
-8.646 mln
-1.38%
jan 1, 1993
634.58 mln
+17.848 mln
2.89%
jan 1, 1994
667.75 mln
+33.17 mln
5.23%
jan 1, 1995
677.555 mln
+9.805 mln
1.47%
jan 1, 1996
692.701 mln
+15.146 mln
2.24%
jan 1, 1997
698.616 mln
+5.915 mln
0.85%
jan 1, 1998
718.948 mln
+20.332 mln
2.91%
jan 1, 1999
726.567 mln
+7.619 mln
1.06%
jan 1, 2000
731.866 mln
+5.299 mln
0.73%
jan 1, 2001
784.187 mln
+52.321 mln
7.15%
jan 1, 2002
746.515 mln
-37.672 mln
-4.8%
jan 1, 2003
705.687 mln
-40.828 mln
-5.47%
jan 1, 2004
680.238 mln
-25.449 mln
-3.61%
jan 1, 2005
774.306 mln
+94.069 mln
13.83%
jan 1, 2006
827.925 mln
+53.619 mln
6.92%
jan 1, 2007
921.524 mln
+93.599 mln
11.31%
jan 1, 2008
989.701 mln
+68.176 mln
7.4%
jan 1, 2009
982.088 mln
-7.613 mln
-0.77%
jan 1, 2010
726.974 mln
-255.114 mln
-25.98%
jan 1, 2011
678.93 mln
-48.044 mln
-6.61%
jan 1, 2012
632.527 mln
-46.403 mln
-6.83%
jan 1, 2013
672.759 mln
+40.231 mln
6.36%
jan 1, 2014
703.791 mln
+31.033 mln
4.61%
jan 1, 2015
742.918 mln
+39.126 mln
5.56%
jan 1, 2016
682.537 mln
-60.38 mln
-8.13%
Ranking of countries by current statistics by years


Comments: