29
/
en
AIzaSyAYiBZKx7MnpbEhh9jyipgxe19OcubqV5w
April 1, 2024
275805
United Kingdom
GBR
true
2
1
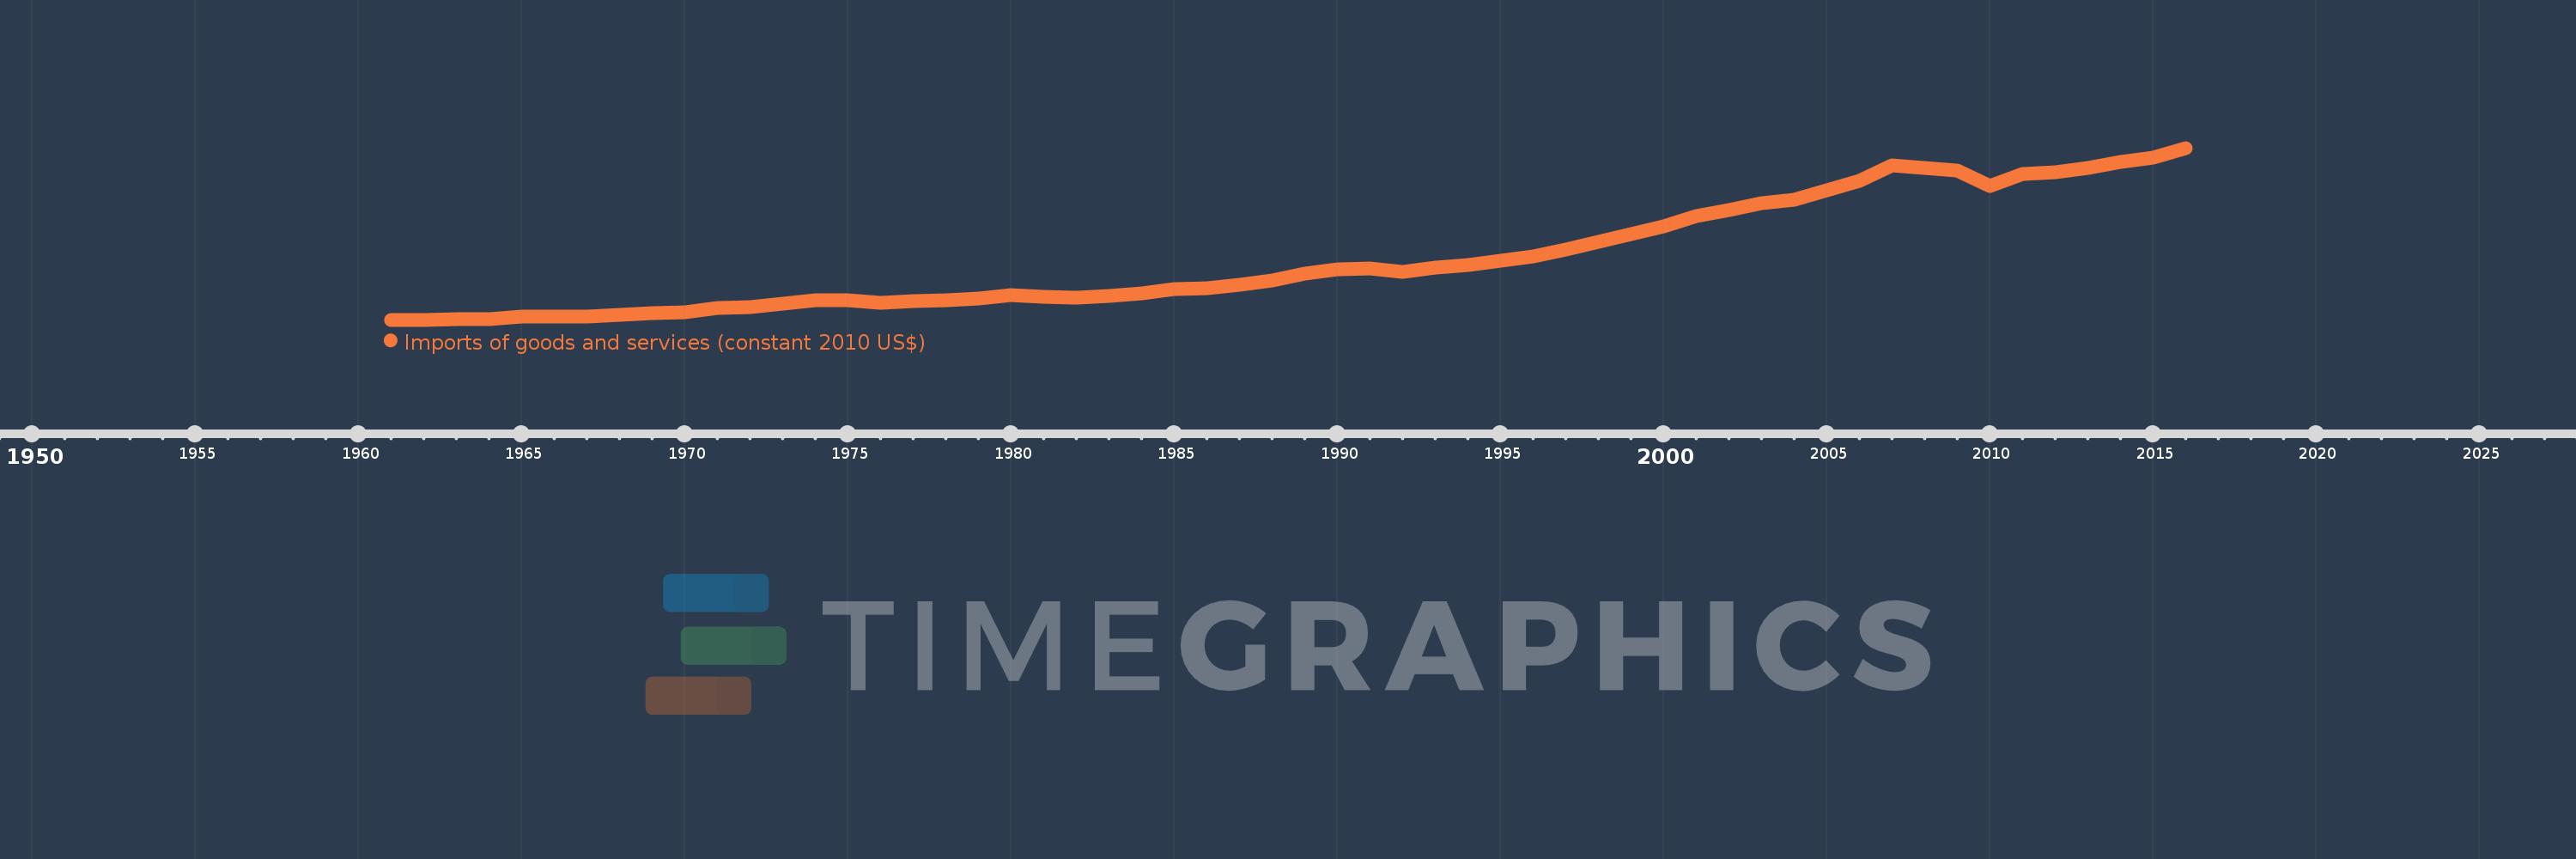
Imports of goods and services (constant 2010 US$)
2016,2015,2014,2013,2012,2011,2010,2009,2008,2007,2006,2005,2004,2003,2002,2001,2000,1999,1998,1997,1996,1995,1994,1993,1992,1991,1990,1989,1988,1987,1986,1985,1984,1983,1982,1981,1980,1979,1978,1977,1976,1975,1974,1973,1972,1971,1970,1969,1968,1967,1966,1965,1964,1963,1962,1961
This statistics in other country:
AfghanistanAlbaniaAlgeriaAngolaAntigua and BarbudaArab WorldArgentinaArmeniaArubaAustraliaAustriaAzerbaijanBahamas, TheBahrainBangladeshBarbadosBelarusBelgiumBelizeBeninBermudaBhutanBoliviaBosnia and HerzegovinaBotswanaBrazilBrunei DarussalamBulgariaBurkina FasoBurundiCabo VerdeCambodiaCameroonCanadaCaribbean small statesCentral African RepublicCentral Europe and the BalticsChadChileChinaColombiaComorosCongo, Dem. Rep.Congo, Rep.Costa RicaCote d'IvoireCroatiaCubaCyprusCzech RepublicDenmarkDominicaDominican RepublicEarly-demographic dividendEast Asia & PacificEast Asia & Pacific (excluding high income)East Asia & Pacific (IDA & IBRD countries)EcuadorEgypt, Arab Rep.El SalvadorEquatorial GuineaEritreaEstoniaEuro areaEurope & Central AsiaEurope & Central Asia (excluding high income)Europe & Central Asia (IDA & IBRD countries)European UnionFaroe IslandsFijiFinlandFragile and conflict affected situationsFranceGabonGambia, TheGeorgiaGermanyGhanaGreeceGrenadaGuatemalaGuineaGuinea-BissauGuyanaHaitiHeavily indebted poor countries (HIPC)High incomeHondurasHong Kong SAR, ChinaHungaryIBRD onlyIcelandIDA & IBRD totalIDA blendIDA onlyIDA totalIndiaIndonesiaIran, Islamic Rep.IraqIrelandIsraelItalyJamaicaJapanJordanKazakhstanKenyaKiribatiKorea, Rep.KosovoKuwaitKyrgyz RepublicLao PDRLate-demographic dividendLatin America & Caribbean Latin America & Caribbean (excluding high income)Latin America & the Caribbean (IDA & IBRD countries)LatviaLeast developed countries: UN classificationLebanonLiberiaLibyaLithuaniaLow & middle incomeLow incomeLower middle incomeLuxembourgMacao SAR, ChinaMacedonia, FYRMadagascarMalawiMalaysiaMaldivesMaliMaltaMauritaniaMauritiusMexicoMiddle East & North AfricaMiddle East & North Africa (excluding high income)Middle East & North Africa (IDA & IBRD countries)Middle incomeMoldovaMongoliaMontenegroMoroccoMozambiqueMyanmarNamibiaNepalNetherlandsNew ZealandNicaraguaNigerNigeriaNorth AmericaNorwayOECD membersOmanOther small statesPacific island small statesPakistanPalauPanamaParaguayPeruPhilippinesPolandPortugalPost-demographic dividendPre-demographic dividendPuerto RicoQatarRomaniaRussian FederationRwandaSamoaSaudi ArabiaSenegalSerbiaSeychellesSierra LeoneSingaporeSlovak RepublicSloveniaSmall statesSolomon IslandsSouth AfricaSouth AsiaSouth Asia (IDA & IBRD)South SudanSpainSri LankaSt. Kitts and NevisSt. LuciaSt. Vincent and the GrenadinesSub-Saharan Africa Sub-Saharan Africa (excluding high income)Sub-Saharan Africa (IDA & IBRD countries)SudanSurinameSwazilandSwedenSwitzerlandTajikistanTanzaniaThailandTimor-LesteTogoTongaTrinidad and TobagoTunisiaTurkeyTurkmenistanUgandaUkraineUnited Arab EmiratesUnited KingdomUnited StatesUpper middle incomeUruguayUzbekistanVanuatuVenezuela, RBVietnamWest Bank and GazaWorldYemen, Rep.ZambiaZimbabwe Timeline:
This timeline shows a graph from 1961 to 2016 of United Kingdom. No data until 1960. Number of actual observations by date: 56.
Source name:
World Development Indicators
Source organization:
World Bank national accounts data, and OECD National Accounts data files.
Categories, topics:
Economy & Growth, Trade
Last updated:
apr 23, 2017
Indicators value changes by year
Minimum:
72.484 bln
jan 1, 1962
Maximum:
871.85 bln
jan 1, 2016
At the date of observation
Value
Absolute change
Change from previous value
jan 1, 1961
72.998 bln
+72.998 bln
0.0%
jan 1, 1962
72.484 bln
-513.294 mln
-0.7%
jan 1, 1963
74.003 bln
+1.518 bln
2.09%
jan 1, 1964
77.093 bln
+3.091 bln
4.18%
jan 1, 1965
85.448 bln
+8.355 bln
10.84%
jan 1, 1966
86.408 bln
+960.183 mln
1.12%
jan 1, 1967
88.536 bln
+2.128 bln
2.46%
jan 1, 1968
94.942 bln
+6.406 bln
7.23%
jan 1, 1969
102.482 bln
+7.54 bln
7.94%
jan 1, 1970
105.475 bln
+2.994 bln
2.92%
jan 1, 1971
125.923 bln
+20.448 bln
19.39%
jan 1, 1972
132.696 bln
+6.773 bln
5.38%
jan 1, 1973
145.857 bln
+13.161 bln
9.92%
jan 1, 1974
162.171 bln
+16.313 bln
11.18%
jan 1, 1975
163.8 bln
+1.63 bln
1.0%
jan 1, 1976
153.001 bln
-10.8 bln
-6.59%
jan 1, 1977
160.893 bln
+7.893 bln
5.16%
jan 1, 1978
163.986 bln
+3.093 bln
1.92%
jan 1, 1979
170.105 bln
+6.119 bln
3.73%
jan 1, 1980
186.512 bln
+16.406 bln
9.64%
jan 1, 1981
179.936 bln
-6.575 bln
-3.53%
jan 1, 1982
175.012 bln
-4.924 bln
-2.74%
jan 1, 1983
183.642 bln
+8.629 bln
4.93%
jan 1, 1984
195.698 bln
+12.056 bln
6.57%
jan 1, 1985
215.025 bln
+19.327 bln
9.88%
jan 1, 1986
220.439 bln
+5.415 bln
2.52%
jan 1, 1987
235.59 bln
+15.151 bln
6.87%
jan 1, 1988
254.168 bln
+18.578 bln
7.89%
jan 1, 1989
286.656 bln
+32.488 bln
12.78%
jan 1, 1990
307.928 bln
+21.272 bln
7.42%
jan 1, 1991
309.66 bln
+1.731 bln
0.56%
jan 1, 1992
296.11 bln
-13.55 bln
-4.38%
jan 1, 1993
316.19 bln
+20.08 bln
6.78%
jan 1, 1994
326.69 bln
+10.5 bln
3.32%
jan 1, 1995
346.078 bln
+19.388 bln
5.93%
jan 1, 1996
365.262 bln
+19.184 bln
5.54%
jan 1, 1997
400.042 bln
+34.78 bln
9.52%
jan 1, 1998
433.178 bln
+33.136 bln
8.28%
jan 1, 1999
472.832 bln
+39.654 bln
9.15%
jan 1, 2000
507.604 bln
+34.772 bln
7.35%
jan 1, 2001
556.198 bln
+48.594 bln
9.57%
jan 1, 2002
582.533 bln
+26.335 bln
4.73%
jan 1, 2003
614.659 bln
+32.126 bln
5.51%
jan 1, 2004
631.441 bln
+16.782 bln
2.73%
jan 1, 2005
673.298 bln
+41.857 bln
6.63%
jan 1, 2006
717.566 bln
+44.268 bln
6.57%
jan 1, 2007
789.798 bln
+72.233 bln
10.07%
jan 1, 2008
780.363 bln
-9.435 bln
-1.19%
jan 1, 2009
765.887 bln
-14.476 bln
-1.86%
jan 1, 2010
695.607 bln
-70.281 bln
-9.18%
jan 1, 2011
752.333 bln
+56.727 bln
8.15%
jan 1, 2012
758.542 bln
+6.208 bln
0.83%
jan 1, 2013
780.197 bln
+21.655 bln
2.85%
jan 1, 2014
806.853 bln
+26.657 bln
3.42%
jan 1, 2015
827.295 bln
+20.442 bln
2.53%
jan 1, 2016
871.85 bln
+44.555 bln
5.39%
Ranking of countries by current statistics by years


Comments: