29
/
en
AIzaSyAYiBZKx7MnpbEhh9jyipgxe19OcubqV5w
April 1, 2024
183034
Macao SAR, China
MAC
true
2
1
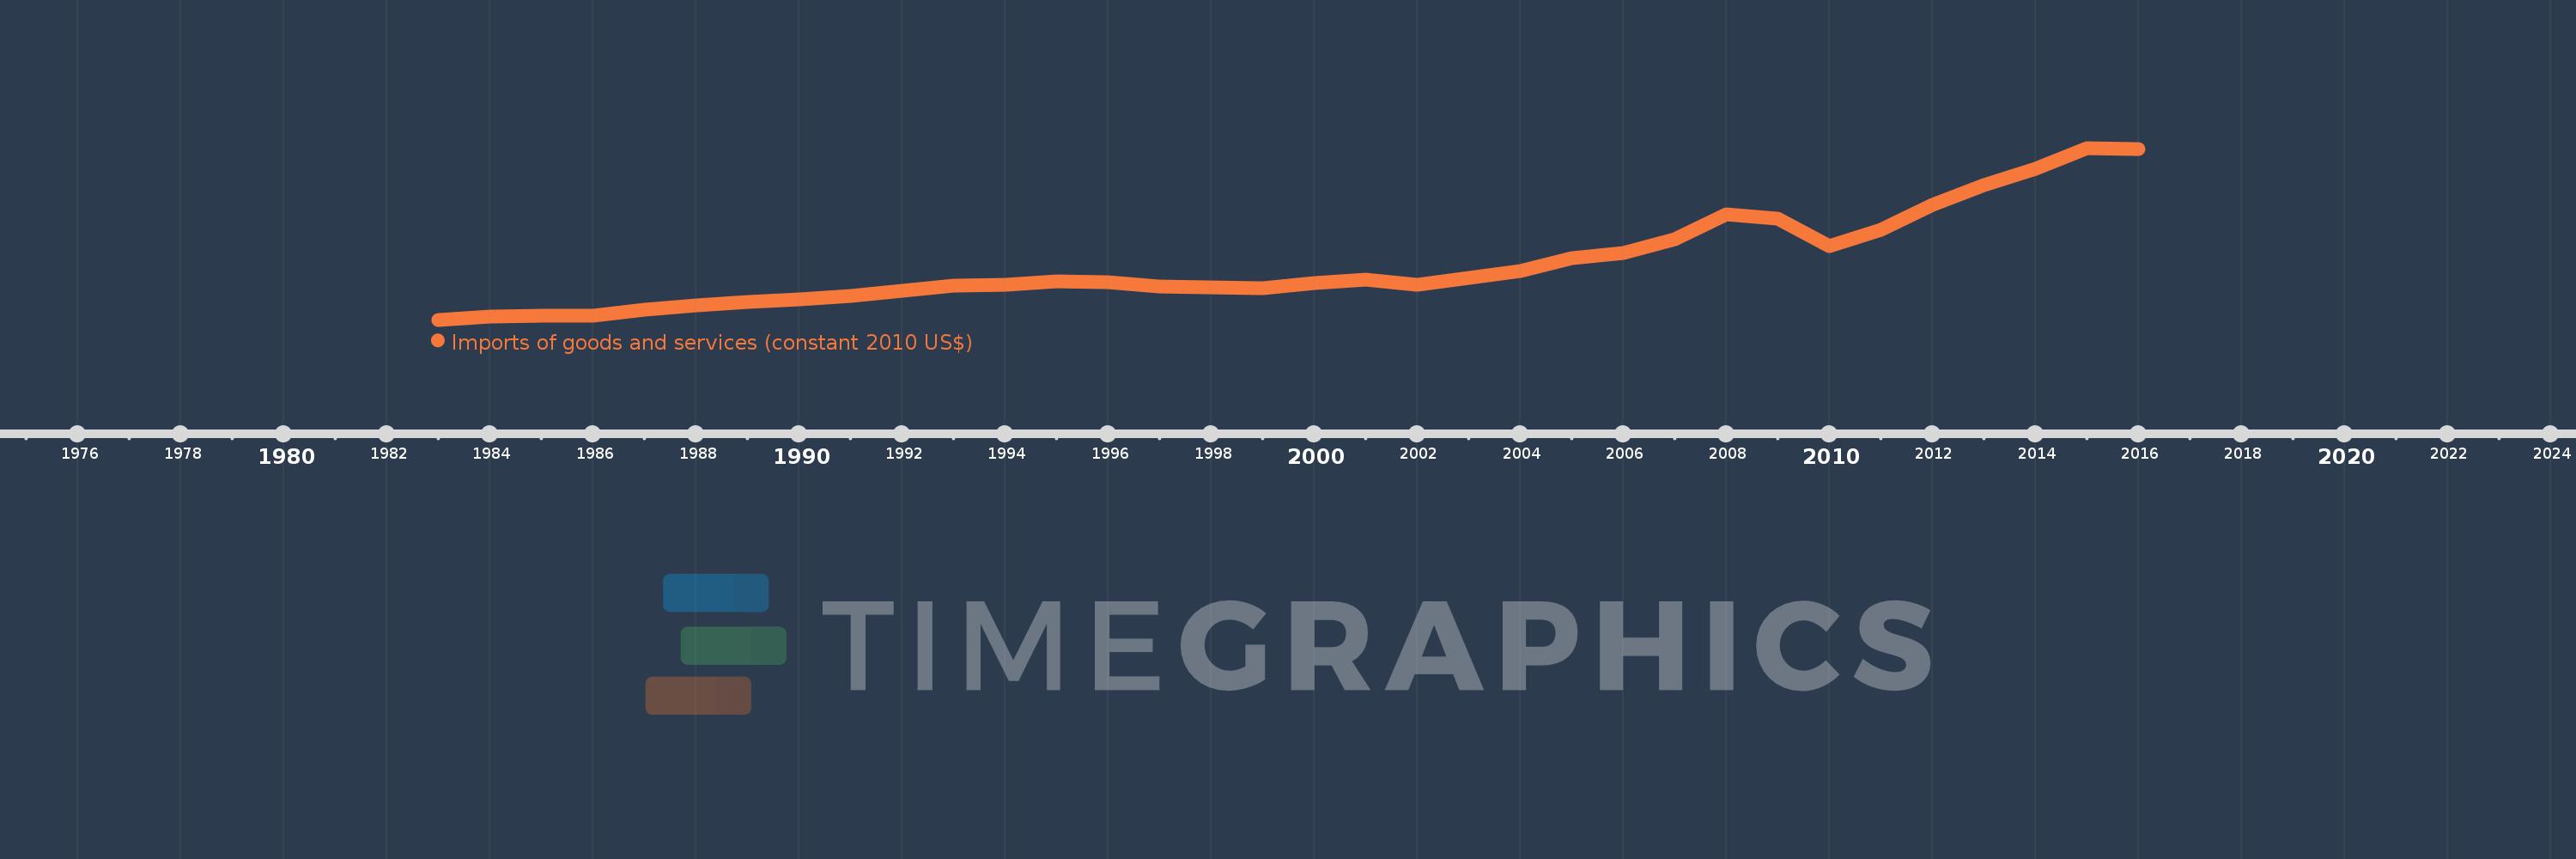
Imports of goods and services (constant 2010 US$)
2016,2015,2014,2013,2012,2011,2010,2009,2008,2007,2006,2005,2004,2003,2002,2001,2000,1999,1998,1997,1996,1995,1994,1993,1992,1991,1990,1989,1988,1987,1986,1985,1984,1983
This statistics in other country:
AfghanistanAlbaniaAlgeriaAngolaAntigua and BarbudaArab WorldArgentinaArmeniaArubaAustraliaAustriaAzerbaijanBahamas, TheBahrainBangladeshBarbadosBelarusBelgiumBelizeBeninBermudaBhutanBoliviaBosnia and HerzegovinaBotswanaBrazilBrunei DarussalamBulgariaBurkina FasoBurundiCabo VerdeCambodiaCameroonCanadaCaribbean small statesCentral African RepublicCentral Europe and the BalticsChadChileChinaColombiaComorosCongo, Dem. Rep.Congo, Rep.Costa RicaCote d'IvoireCroatiaCubaCyprusCzech RepublicDenmarkDominicaDominican RepublicEarly-demographic dividendEast Asia & PacificEast Asia & Pacific (excluding high income)East Asia & Pacific (IDA & IBRD countries)EcuadorEgypt, Arab Rep.El SalvadorEquatorial GuineaEritreaEstoniaEuro areaEurope & Central AsiaEurope & Central Asia (excluding high income)Europe & Central Asia (IDA & IBRD countries)European UnionFaroe IslandsFijiFinlandFragile and conflict affected situationsFranceGabonGambia, TheGeorgiaGermanyGhanaGreeceGrenadaGuatemalaGuineaGuinea-BissauGuyanaHaitiHeavily indebted poor countries (HIPC)High incomeHondurasHong Kong SAR, ChinaHungaryIBRD onlyIcelandIDA & IBRD totalIDA blendIDA onlyIDA totalIndiaIndonesiaIran, Islamic Rep.IraqIrelandIsraelItalyJamaicaJapanJordanKazakhstanKenyaKiribatiKorea, Rep.KosovoKuwaitKyrgyz RepublicLao PDRLate-demographic dividendLatin America & Caribbean Latin America & Caribbean (excluding high income)Latin America & the Caribbean (IDA & IBRD countries)LatviaLeast developed countries: UN classificationLebanonLiberiaLibyaLithuaniaLow & middle incomeLow incomeLower middle incomeLuxembourgMacao SAR, ChinaMacedonia, FYRMadagascarMalawiMalaysiaMaldivesMaliMaltaMauritaniaMauritiusMexicoMiddle East & North AfricaMiddle East & North Africa (excluding high income)Middle East & North Africa (IDA & IBRD countries)Middle incomeMoldovaMongoliaMontenegroMoroccoMozambiqueMyanmarNamibiaNepalNetherlandsNew ZealandNicaraguaNigerNigeriaNorth AmericaNorwayOECD membersOmanOther small statesPacific island small statesPakistanPalauPanamaParaguayPeruPhilippinesPolandPortugalPost-demographic dividendPre-demographic dividendPuerto RicoQatarRomaniaRussian FederationRwandaSamoaSaudi ArabiaSenegalSerbiaSeychellesSierra LeoneSingaporeSlovak RepublicSloveniaSmall statesSolomon IslandsSouth AfricaSouth AsiaSouth Asia (IDA & IBRD)South SudanSpainSri LankaSt. Kitts and NevisSt. LuciaSt. Vincent and the GrenadinesSub-Saharan Africa Sub-Saharan Africa (excluding high income)Sub-Saharan Africa (IDA & IBRD countries)SudanSurinameSwazilandSwedenSwitzerlandTajikistanTanzaniaThailandTimor-LesteTogoTongaTrinidad and TobagoTunisiaTurkeyTurkmenistanUgandaUkraineUnited Arab EmiratesUnited KingdomUnited StatesUpper middle incomeUruguayUzbekistanVanuatuVenezuela, RBVietnamWest Bank and GazaWorldYemen, Rep.ZambiaZimbabwe Timeline:
This timeline shows a graph from 1983 to 2016 of Macao SAR, China. No data until 1982. Number of actual observations by date: 34.
Source name:
World Development Indicators
Source organization:
World Bank national accounts data, and OECD National Accounts data files.
Categories, topics:
Economy & Growth, Trade
Last updated:
apr 23, 2017
Indicators value changes by year
Minimum:
1.892 bln
jan 1, 1983
Maximum:
15.829 bln
jan 1, 2015
At the date of observation
Value
Absolute change
Change from previous value
jan 1, 1983
1.892 bln
+1.892 bln
0.0%
jan 1, 1984
2.138 bln
+246.0 mln
13.0%
jan 1, 1985
2.249 bln
+111.192 mln
5.2%
jan 1, 1986
2.227 bln
-22.495 mln
-1.0%
jan 1, 1987
2.677 bln
+449.854 mln
20.2%
jan 1, 1988
3.028 bln
+350.668 mln
13.1%
jan 1, 1989
3.333 bln
+305.78 mln
10.1%
jan 1, 1990
3.577 bln
+243.331 mln
7.3%
jan 1, 1991
3.795 bln
+218.175 mln
6.1%
jan 1, 1992
4.208 bln
+413.634 mln
10.9%
jan 1, 1993
4.655 bln
+446.095 mln
10.6%
jan 1, 1994
4.734 bln
+79.127 mln
1.7%
jan 1, 1995
4.994 bln
+260.352 mln
5.5%
jan 1, 1996
4.954 bln
-39.952 mln
-0.8%
jan 1, 1997
4.563 bln
-391.371 mln
-7.9%
jan 1, 1998
4.513 bln
-50.19 mln
-1.1%
jan 1, 1999
4.467 bln
-45.125 mln
-1.0%
jan 1, 2000
4.874 bln
+406.531 mln
9.1%
jan 1, 2001
5.132 bln
+258.317 mln
5.3%
jan 1, 2002
4.741 bln
-391.128 mln
-7.62%
jan 1, 2003
5.284 bln
+543.359 mln
11.46%
jan 1, 2004
5.84 bln
+555.919 mln
10.52%
jan 1, 2005
6.881 bln
+1.041 bln
17.82%
jan 1, 2006
7.329 bln
+448.198 mln
6.51%
jan 1, 2007
8.416 bln
+1.086 bln
14.82%
jan 1, 2008
10.477 bln
+2.062 bln
24.5%
jan 1, 2009
10.067 bln
-410.405 mln
-3.92%
jan 1, 2010
7.869 bln
-2.197 bln
-21.83%
jan 1, 2011
9.183 bln
+1.314 bln
16.7%
jan 1, 2012
11.203 bln
+2.02 bln
21.99%
jan 1, 2013
12.804 bln
+1.601 bln
14.29%
jan 1, 2014
14.169 bln
+1.365 bln
10.66%
jan 1, 2015
15.829 bln
+1.66 bln
11.72%
jan 1, 2016
15.716 bln
-113.153 mln
-0.71%
Ranking of countries by current statistics by years


Comments: