29
/
en
AIzaSyAYiBZKx7MnpbEhh9jyipgxe19OcubqV5w
April 1, 2024
209433
New Zealand
NZL
true
2
1
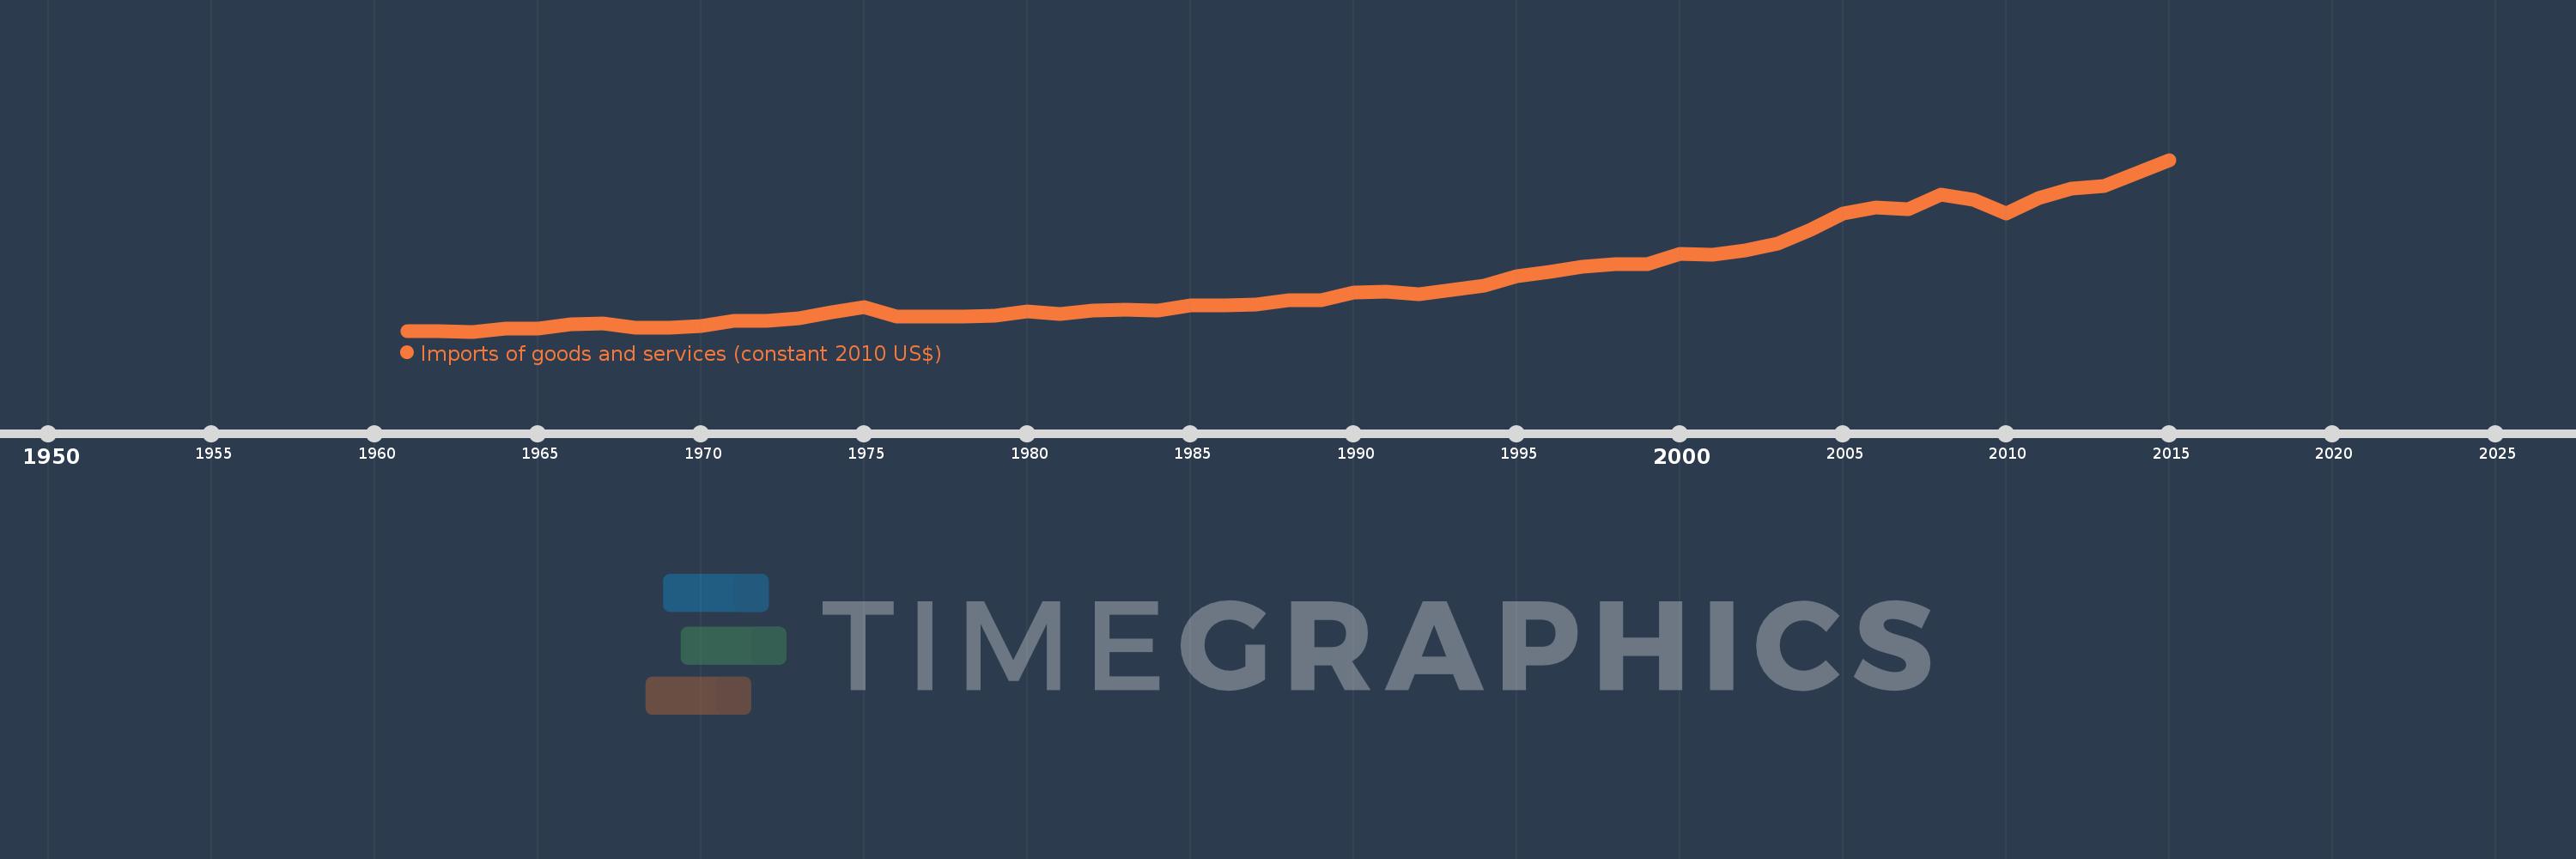
Imports of goods and services (constant 2010 US$)
2015,2014,2013,2012,2011,2010,2009,2008,2007,2006,2005,2004,2003,2002,2001,2000,1999,1998,1997,1996,1995,1994,1993,1992,1991,1990,1989,1988,1987,1986,1985,1984,1983,1982,1981,1980,1979,1978,1977,1976,1975,1974,1973,1972,1971,1970,1969,1968,1967,1966,1965,1964,1963,1962,1961
This statistics in other country:
AfghanistanAlbaniaAlgeriaAngolaAntigua and BarbudaArab WorldArgentinaArmeniaArubaAustraliaAustriaAzerbaijanBahamas, TheBahrainBangladeshBarbadosBelarusBelgiumBelizeBeninBermudaBhutanBoliviaBosnia and HerzegovinaBotswanaBrazilBrunei DarussalamBulgariaBurkina FasoBurundiCabo VerdeCambodiaCameroonCanadaCaribbean small statesCentral African RepublicCentral Europe and the BalticsChadChileChinaColombiaComorosCongo, Dem. Rep.Congo, Rep.Costa RicaCote d'IvoireCroatiaCubaCyprusCzech RepublicDenmarkDominicaDominican RepublicEarly-demographic dividendEast Asia & PacificEast Asia & Pacific (excluding high income)East Asia & Pacific (IDA & IBRD countries)EcuadorEgypt, Arab Rep.El SalvadorEquatorial GuineaEritreaEstoniaEuro areaEurope & Central AsiaEurope & Central Asia (excluding high income)Europe & Central Asia (IDA & IBRD countries)European UnionFaroe IslandsFijiFinlandFragile and conflict affected situationsFranceGabonGambia, TheGeorgiaGermanyGhanaGreeceGrenadaGuatemalaGuineaGuinea-BissauGuyanaHaitiHeavily indebted poor countries (HIPC)High incomeHondurasHong Kong SAR, ChinaHungaryIBRD onlyIcelandIDA & IBRD totalIDA blendIDA onlyIDA totalIndiaIndonesiaIran, Islamic Rep.IraqIrelandIsraelItalyJamaicaJapanJordanKazakhstanKenyaKiribatiKorea, Rep.KosovoKuwaitKyrgyz RepublicLao PDRLate-demographic dividendLatin America & Caribbean Latin America & Caribbean (excluding high income)Latin America & the Caribbean (IDA & IBRD countries)LatviaLeast developed countries: UN classificationLebanonLiberiaLibyaLithuaniaLow & middle incomeLow incomeLower middle incomeLuxembourgMacao SAR, ChinaMacedonia, FYRMadagascarMalawiMalaysiaMaldivesMaliMaltaMauritaniaMauritiusMexicoMiddle East & North AfricaMiddle East & North Africa (excluding high income)Middle East & North Africa (IDA & IBRD countries)Middle incomeMoldovaMongoliaMontenegroMoroccoMozambiqueMyanmarNamibiaNepalNetherlandsNew ZealandNicaraguaNigerNigeriaNorth AmericaNorwayOECD membersOmanOther small statesPacific island small statesPakistanPalauPanamaParaguayPeruPhilippinesPolandPortugalPost-demographic dividendPre-demographic dividendPuerto RicoQatarRomaniaRussian FederationRwandaSamoaSaudi ArabiaSenegalSerbiaSeychellesSierra LeoneSingaporeSlovak RepublicSloveniaSmall statesSolomon IslandsSouth AfricaSouth AsiaSouth Asia (IDA & IBRD)South SudanSpainSri LankaSt. Kitts and NevisSt. LuciaSt. Vincent and the GrenadinesSub-Saharan Africa Sub-Saharan Africa (excluding high income)Sub-Saharan Africa (IDA & IBRD countries)SudanSurinameSwazilandSwedenSwitzerlandTajikistanTanzaniaThailandTimor-LesteTogoTongaTrinidad and TobagoTunisiaTurkeyTurkmenistanUgandaUkraineUnited Arab EmiratesUnited KingdomUnited StatesUpper middle incomeUruguayUzbekistanVanuatuVenezuela, RBVietnamWest Bank and GazaWorldYemen, Rep.ZambiaZimbabwe Timeline:
This timeline shows a graph from 1961 to 2015 of New Zealand. No data until 1960. Number of actual observations by date: 55.
Source name:
World Development Indicators
Source organization:
World Bank national accounts data, and OECD National Accounts data files.
Categories, topics:
Economy & Growth, Trade
Last updated:
apr 23, 2017
Indicators value changes by year
Minimum:
4.716 bln
jan 1, 1963
Maximum:
51.42 bln
jan 1, 2015
At the date of observation
Value
Absolute change
Change from previous value
jan 1, 1961
4.832 bln
+4.832 bln
0.0%
jan 1, 1962
4.904 bln
+71.117 mln
1.47%
jan 1, 1963
4.716 bln
-187.038 mln
-3.81%
jan 1, 1964
5.487 bln
+770.907 mln
16.34%
jan 1, 1965
5.626 bln
+138.678 mln
2.53%
jan 1, 1966
6.635 bln
+1.009 bln
17.94%
jan 1, 1967
7.032 bln
+397.254 mln
5.99%
jan 1, 1968
5.729 bln
-1.303 bln
-18.53%
jan 1, 1969
5.723 bln
-6.809 mln
-0.12%
jan 1, 1970
6.345 bln
+622.736 mln
10.88%
jan 1, 1971
7.695 bln
+1.349 bln
21.26%
jan 1, 1972
7.546 bln
-148.596 mln
-1.93%
jan 1, 1973
8.251 bln
+704.703 mln
9.34%
jan 1, 1974
10.01 bln
+1.759 bln
21.32%
jan 1, 1975
11.339 bln
+1.329 bln
13.28%
jan 1, 1976
8.89 bln
-2.449 bln
-21.6%
jan 1, 1977
8.757 bln
-133.586 mln
-1.5%
jan 1, 1978
8.862 bln
+105.068 mln
1.2%
jan 1, 1979
9.007 bln
+144.843 mln
1.63%
jan 1, 1980
10.135 bln
+1.129 bln
12.53%
jan 1, 1981
9.437 bln
-698.699 mln
-6.89%
jan 1, 1982
10.472 bln
+1.036 bln
10.98%
jan 1, 1983
10.625 bln
+152.348 mln
1.45%
jan 1, 1984
10.541 bln
-84.054 mln
-0.79%
jan 1, 1985
11.756 bln
+1.216 bln
11.53%
jan 1, 1986
11.936 bln
+179.365 mln
1.53%
jan 1, 1987
12.178 bln
+242.406 mln
2.03%
jan 1, 1988
13.233 bln
+1.055 bln
8.66%
jan 1, 1989
13.258 bln
+25.075 mln
0.19%
jan 1, 1990
15.353 bln
+2.095 bln
15.8%
jan 1, 1991
15.55 bln
+197.019 mln
1.28%
jan 1, 1992
14.975 bln
-575.297 mln
-3.7%
jan 1, 1993
16.088 bln
+1.113 bln
7.43%
jan 1, 1994
17.234 bln
+1.146 bln
7.12%
jan 1, 1995
19.698 bln
+2.464 bln
14.3%
jan 1, 1996
20.938 bln
+1.24 bln
6.3%
jan 1, 1997
22.253 bln
+1.315 bln
6.28%
jan 1, 1998
23.031 bln
+778.048 mln
3.5%
jan 1, 1999
23.164 bln
+132.54 mln
0.58%
jan 1, 2000
25.878 bln
+2.714 bln
11.72%
jan 1, 2001
25.585 bln
-293.022 mln
-1.13%
jan 1, 2002
26.679 bln
+1.095 bln
4.28%
jan 1, 2003
28.64 bln
+1.961 bln
7.35%
jan 1, 2004
32.412 bln
+3.772 bln
13.17%
jan 1, 2005
36.744 bln
+4.332 bln
13.36%
jan 1, 2006
38.535 bln
+1.791 bln
4.87%
jan 1, 2007
37.888 bln
-646.94 mln
-1.68%
jan 1, 2008
42.022 bln
+4.135 bln
10.91%
jan 1, 2009
40.559 bln
-1.464 bln
-3.48%
jan 1, 2010
36.767 bln
-3.791 bln
-9.35%
jan 1, 2011
40.994 bln
+4.226 bln
11.49%
jan 1, 2012
43.689 bln
+2.695 bln
6.57%
jan 1, 2013
44.27 bln
+581.028 mln
1.33%
jan 1, 2014
47.864 bln
+3.594 bln
8.12%
jan 1, 2015
51.42 bln
+3.556 bln
7.43%
Ranking of countries by current statistics by years


Comments: