29
/
en
AIzaSyAYiBZKx7MnpbEhh9jyipgxe19OcubqV5w
April 1, 2024
71269
Armenia
ARM
true
2
1
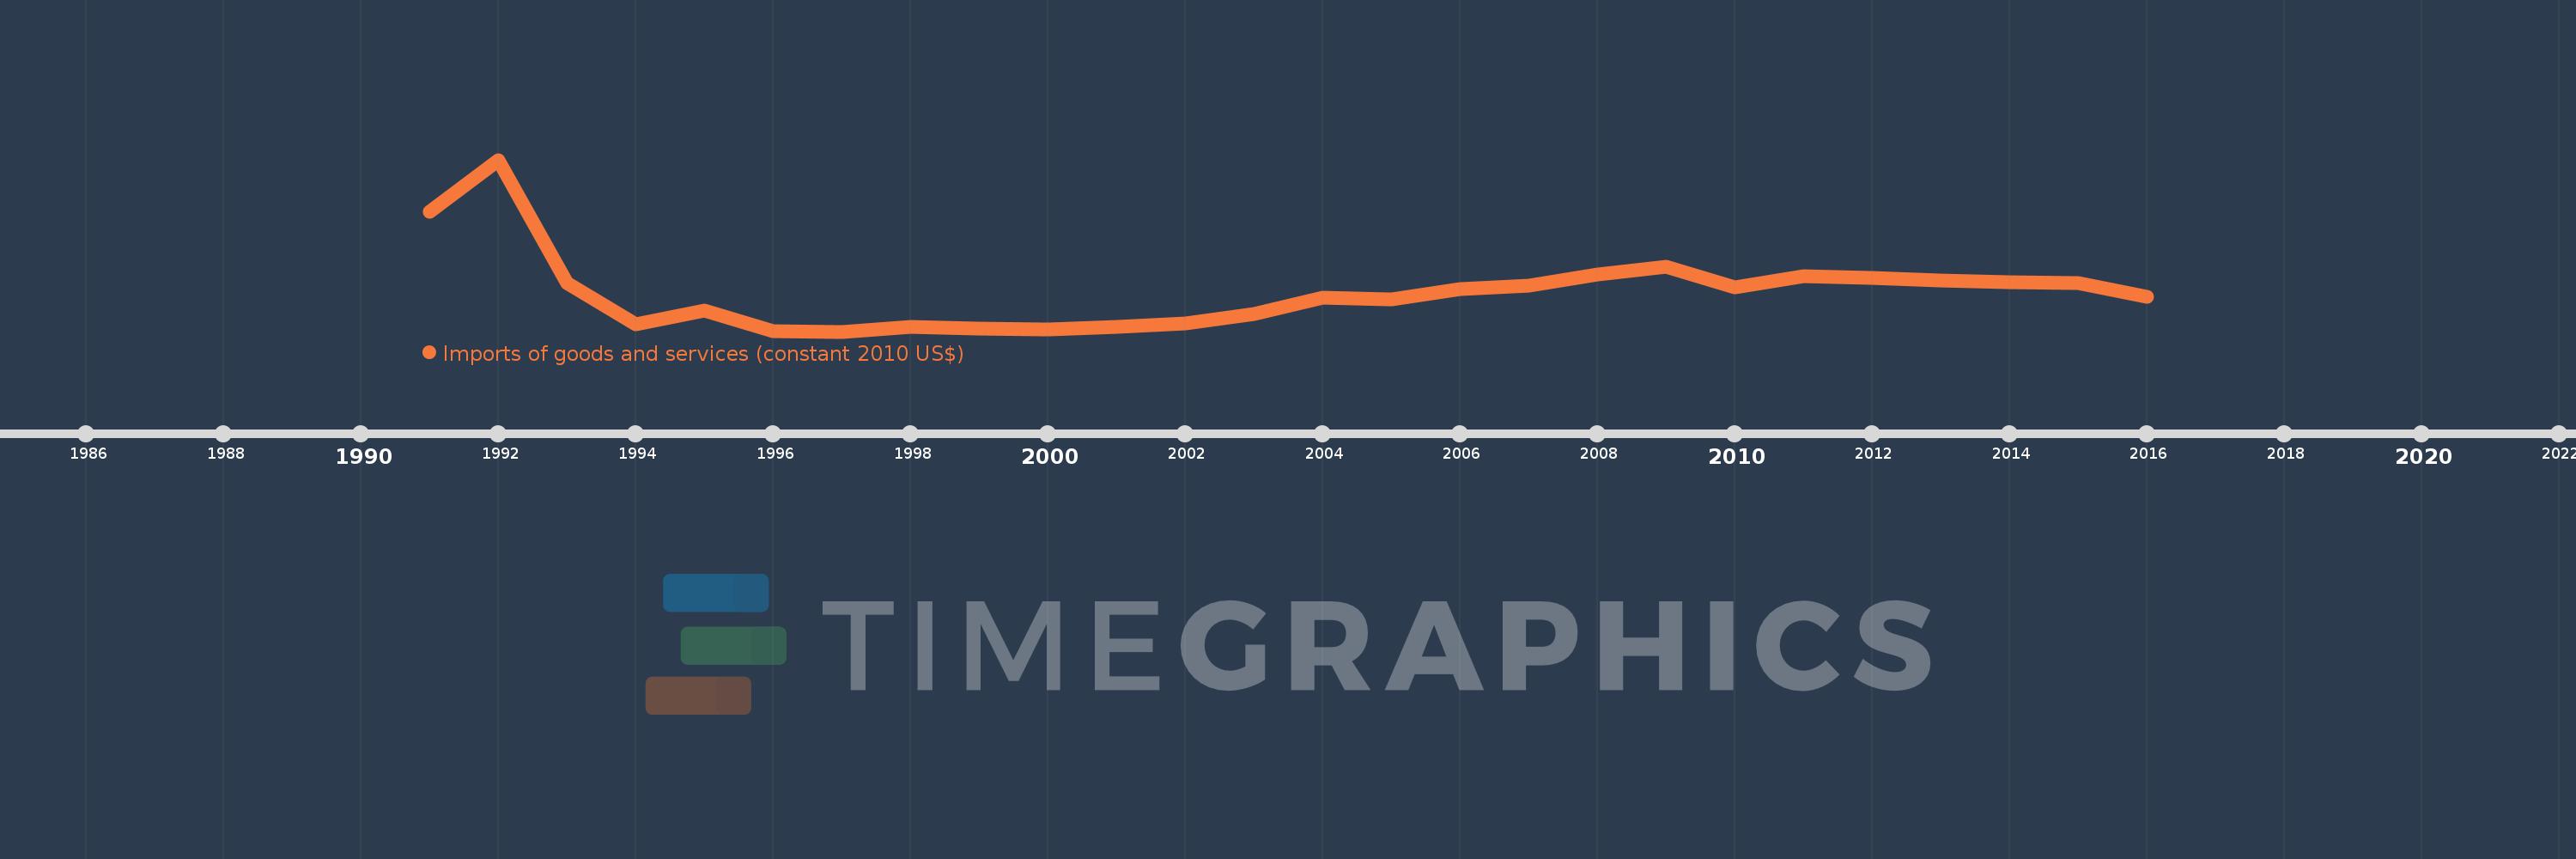
Imports of goods and services (constant 2010 US$)
2016,2015,2014,2013,2012,2011,2010,2009,2008,2007,2006,2005,2004,2003,2002,2001,2000,1999,1998,1997,1996,1995,1994,1993,1992,1991
This statistics in other country:
AfghanistanAlbaniaAlgeriaAngolaAntigua and BarbudaArab WorldArgentinaArmeniaArubaAustraliaAustriaAzerbaijanBahamas, TheBahrainBangladeshBarbadosBelarusBelgiumBelizeBeninBermudaBhutanBoliviaBosnia and HerzegovinaBotswanaBrazilBrunei DarussalamBulgariaBurkina FasoBurundiCabo VerdeCambodiaCameroonCanadaCaribbean small statesCentral African RepublicCentral Europe and the BalticsChadChileChinaColombiaComorosCongo, Dem. Rep.Congo, Rep.Costa RicaCote d'IvoireCroatiaCubaCyprusCzech RepublicDenmarkDominicaDominican RepublicEarly-demographic dividendEast Asia & PacificEast Asia & Pacific (excluding high income)East Asia & Pacific (IDA & IBRD countries)EcuadorEgypt, Arab Rep.El SalvadorEquatorial GuineaEritreaEstoniaEuro areaEurope & Central AsiaEurope & Central Asia (excluding high income)Europe & Central Asia (IDA & IBRD countries)European UnionFaroe IslandsFijiFinlandFragile and conflict affected situationsFranceGabonGambia, TheGeorgiaGermanyGhanaGreeceGrenadaGuatemalaGuineaGuinea-BissauGuyanaHaitiHeavily indebted poor countries (HIPC)High incomeHondurasHong Kong SAR, ChinaHungaryIBRD onlyIcelandIDA & IBRD totalIDA blendIDA onlyIDA totalIndiaIndonesiaIran, Islamic Rep.IraqIrelandIsraelItalyJamaicaJapanJordanKazakhstanKenyaKiribatiKorea, Rep.KosovoKuwaitKyrgyz RepublicLao PDRLate-demographic dividendLatin America & Caribbean Latin America & Caribbean (excluding high income)Latin America & the Caribbean (IDA & IBRD countries)LatviaLeast developed countries: UN classificationLebanonLiberiaLibyaLithuaniaLow & middle incomeLow incomeLower middle incomeLuxembourgMacao SAR, ChinaMacedonia, FYRMadagascarMalawiMalaysiaMaldivesMaliMaltaMauritaniaMauritiusMexicoMiddle East & North AfricaMiddle East & North Africa (excluding high income)Middle East & North Africa (IDA & IBRD countries)Middle incomeMoldovaMongoliaMontenegroMoroccoMozambiqueMyanmarNamibiaNepalNetherlandsNew ZealandNicaraguaNigerNigeriaNorth AmericaNorwayOECD membersOmanOther small statesPacific island small statesPakistanPalauPanamaParaguayPeruPhilippinesPolandPortugalPost-demographic dividendPre-demographic dividendPuerto RicoQatarRomaniaRussian FederationRwandaSamoaSaudi ArabiaSenegalSerbiaSeychellesSierra LeoneSingaporeSlovak RepublicSloveniaSmall statesSolomon IslandsSouth AfricaSouth AsiaSouth Asia (IDA & IBRD)South SudanSpainSri LankaSt. Kitts and NevisSt. LuciaSt. Vincent and the GrenadinesSub-Saharan Africa Sub-Saharan Africa (excluding high income)Sub-Saharan Africa (IDA & IBRD countries)SudanSurinameSwazilandSwedenSwitzerlandTajikistanTanzaniaThailandTimor-LesteTogoTongaTrinidad and TobagoTunisiaTurkeyTurkmenistanUgandaUkraineUnited Arab EmiratesUnited KingdomUnited StatesUpper middle incomeUruguayUzbekistanVanuatuVenezuela, RBVietnamWest Bank and GazaWorldYemen, Rep.ZambiaZimbabwe Timeline:
This timeline shows a graph from 1991 to 2016 of Armenia. No data until 1990. Number of actual observations by date: 26.
Source name:
World Development Indicators
Source organization:
World Bank national accounts data, and OECD National Accounts data files.
Categories, topics:
Economy & Growth, Trade
Last updated:
apr 23, 2017
Indicators value changes by year
Minimum:
1.844 bln
jan 1, 1997
Maximum:
9.147 bln
jan 1, 1992
At the date of observation
Value
Absolute change
Change from previous value
jan 1, 1991
6.924 bln
+6.924 bln
0.0%
jan 1, 1992
9.147 bln
+2.223 bln
32.1%
jan 1, 1993
3.924 bln
-5.223 bln
-57.1%
jan 1, 1994
2.166 bln
-1.758 bln
-44.8%
jan 1, 1995
2.753 bln
+587.009 mln
27.1%
jan 1, 1996
1.856 bln
-897.509 mln
-32.6%
jan 1, 1997
1.844 bln
-11.133 mln
-0.6%
jan 1, 1998
2.058 bln
+213.956 mln
11.6%
jan 1, 1999
1.958 bln
-100.862 mln
-4.9%
jan 1, 2000
1.92 bln
-37.193 mln
-1.9%
jan 1, 2001
2.059 bln
+138.265 mln
7.2%
jan 1, 2002
2.191 bln
+131.898 mln
6.41%
jan 1, 2003
2.606 bln
+415.039 mln
18.95%
jan 1, 2004
3.297 bln
+691.561 mln
26.54%
jan 1, 2005
3.201 bln
-96.326 mln
-2.92%
jan 1, 2006
3.659 bln
+457.801 mln
14.3%
jan 1, 2007
3.796 bln
+137.6 mln
3.76%
jan 1, 2008
4.289 bln
+493.308 mln
12.99%
jan 1, 2009
4.602 bln
+312.194 mln
7.28%
jan 1, 2010
3.72 bln
-881.391 mln
-19.15%
jan 1, 2011
4.197 bln
+476.199 mln
12.8%
jan 1, 2012
4.138 bln
-58.751 mln
-1.4%
jan 1, 2013
4.022 bln
-115.857 mln
-2.8%
jan 1, 2014
3.937 bln
-84.46 mln
-2.1%
jan 1, 2015
3.898 bln
-39.374 mln
-1.0%
jan 1, 2016
3.309 bln
-588.607 mln
-15.1%
Ranking of countries by current statistics by years


Comments: