29
/
en
AIzaSyAYiBZKx7MnpbEhh9jyipgxe19OcubqV5w
April 1, 2024
150503
Honduras
HND
true
2
1
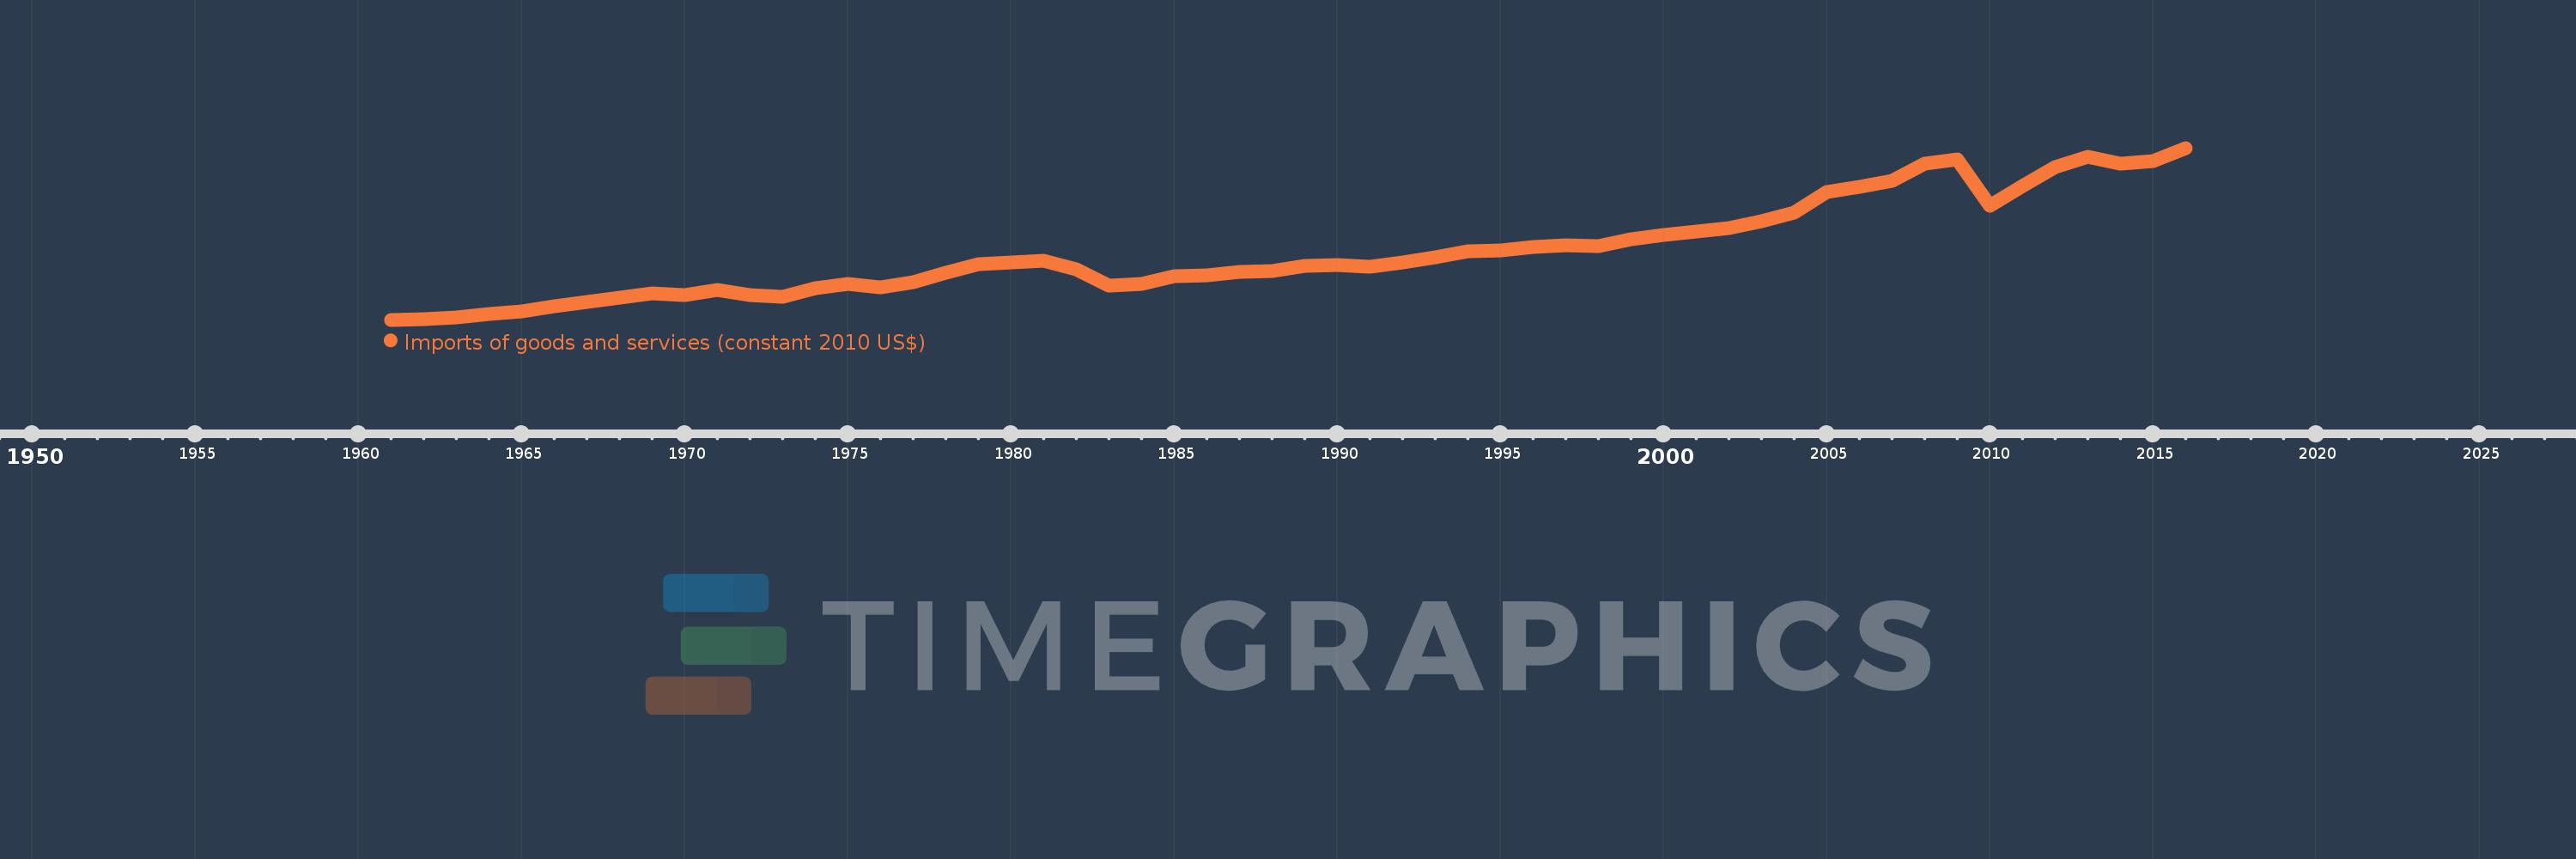
Imports of goods and services (constant 2010 US$)
2016,2015,2014,2013,2012,2011,2010,2009,2008,2007,2006,2005,2004,2003,2002,2001,2000,1999,1998,1997,1996,1995,1994,1993,1992,1991,1990,1989,1988,1987,1986,1985,1984,1983,1982,1981,1980,1979,1978,1977,1976,1975,1974,1973,1972,1971,1970,1969,1968,1967,1966,1965,1964,1963,1962,1961
This statistics in other country:
AfghanistanAlbaniaAlgeriaAngolaAntigua and BarbudaArab WorldArgentinaArmeniaArubaAustraliaAustriaAzerbaijanBahamas, TheBahrainBangladeshBarbadosBelarusBelgiumBelizeBeninBermudaBhutanBoliviaBosnia and HerzegovinaBotswanaBrazilBrunei DarussalamBulgariaBurkina FasoBurundiCabo VerdeCambodiaCameroonCanadaCaribbean small statesCentral African RepublicCentral Europe and the BalticsChadChileChinaColombiaComorosCongo, Dem. Rep.Congo, Rep.Costa RicaCote d'IvoireCroatiaCubaCyprusCzech RepublicDenmarkDominicaDominican RepublicEarly-demographic dividendEast Asia & PacificEast Asia & Pacific (excluding high income)East Asia & Pacific (IDA & IBRD countries)EcuadorEgypt, Arab Rep.El SalvadorEquatorial GuineaEritreaEstoniaEuro areaEurope & Central AsiaEurope & Central Asia (excluding high income)Europe & Central Asia (IDA & IBRD countries)European UnionFaroe IslandsFijiFinlandFragile and conflict affected situationsFranceGabonGambia, TheGeorgiaGermanyGhanaGreeceGrenadaGuatemalaGuineaGuinea-BissauGuyanaHaitiHeavily indebted poor countries (HIPC)High incomeHondurasHong Kong SAR, ChinaHungaryIBRD onlyIcelandIDA & IBRD totalIDA blendIDA onlyIDA totalIndiaIndonesiaIran, Islamic Rep.IraqIrelandIsraelItalyJamaicaJapanJordanKazakhstanKenyaKiribatiKorea, Rep.KosovoKuwaitKyrgyz RepublicLao PDRLate-demographic dividendLatin America & Caribbean Latin America & Caribbean (excluding high income)Latin America & the Caribbean (IDA & IBRD countries)LatviaLeast developed countries: UN classificationLebanonLiberiaLibyaLithuaniaLow & middle incomeLow incomeLower middle incomeLuxembourgMacao SAR, ChinaMacedonia, FYRMadagascarMalawiMalaysiaMaldivesMaliMaltaMauritaniaMauritiusMexicoMiddle East & North AfricaMiddle East & North Africa (excluding high income)Middle East & North Africa (IDA & IBRD countries)Middle incomeMoldovaMongoliaMontenegroMoroccoMozambiqueMyanmarNamibiaNepalNetherlandsNew ZealandNicaraguaNigerNigeriaNorth AmericaNorwayOECD membersOmanOther small statesPacific island small statesPakistanPalauPanamaParaguayPeruPhilippinesPolandPortugalPost-demographic dividendPre-demographic dividendPuerto RicoQatarRomaniaRussian FederationRwandaSamoaSaudi ArabiaSenegalSerbiaSeychellesSierra LeoneSingaporeSlovak RepublicSloveniaSmall statesSolomon IslandsSouth AfricaSouth AsiaSouth Asia (IDA & IBRD)South SudanSpainSri LankaSt. Kitts and NevisSt. LuciaSt. Vincent and the GrenadinesSub-Saharan Africa Sub-Saharan Africa (excluding high income)Sub-Saharan Africa (IDA & IBRD countries)SudanSurinameSwazilandSwedenSwitzerlandTajikistanTanzaniaThailandTimor-LesteTogoTongaTrinidad and TobagoTunisiaTurkeyTurkmenistanUgandaUkraineUnited Arab EmiratesUnited KingdomUnited StatesUpper middle incomeUruguayUzbekistanVanuatuVenezuela, RBVietnamWest Bank and GazaWorldYemen, Rep.ZambiaZimbabwe Timeline:
This timeline shows a graph from 1961 to 2016 of Honduras. No data until 1960. Number of actual observations by date: 56.
Source name:
World Development Indicators
Source organization:
World Bank national accounts data, and OECD National Accounts data files.
Categories, topics:
Economy & Growth, Trade
Last updated:
apr 23, 2017
Indicators value changes by year
Minimum:
1.135 bln
jan 1, 1961
Maximum:
12.561 bln
jan 1, 2016
At the date of observation
Value
Absolute change
Change from previous value
jan 1, 1961
1.135 bln
+1.135 bln
0.0%
jan 1, 1962
1.159 bln
+24.135 mln
2.13%
jan 1, 1963
1.27 bln
+111.082 mln
9.58%
jan 1, 1964
1.526 bln
+255.272 mln
20.09%
jan 1, 1965
1.711 bln
+185.033 mln
12.13%
jan 1, 1966
2.004 bln
+293.332 mln
17.15%
jan 1, 1967
2.344 bln
+340.053 mln
16.97%
jan 1, 1968
2.608 bln
+263.626 mln
11.25%
jan 1, 1969
2.862 bln
+253.725 mln
9.73%
jan 1, 1970
2.757 bln
-104.275 mln
-3.64%
jan 1, 1971
3.125 bln
+367.901 mln
13.34%
jan 1, 1972
2.791 bln
-334.174 mln
-10.69%
jan 1, 1973
2.673 bln
-117.58 mln
-4.21%
jan 1, 1974
3.23 bln
+556.957 mln
20.83%
jan 1, 1975
3.543 bln
+312.515 mln
9.67%
jan 1, 1976
3.289 bln
-253.725 mln
-7.16%
jan 1, 1977
3.62 bln
+331.08 mln
10.07%
jan 1, 1978
4.273 bln
+652.877 mln
18.03%
jan 1, 1979
4.811 bln
+538.392 mln
12.6%
jan 1, 1980
4.935 bln
+123.768 mln
2.57%
jan 1, 1981
5.047 bln
+111.391 mln
2.26%
jan 1, 1982
4.474 bln
-572.429 mln
-11.34%
jan 1, 1983
3.419 bln
-1.055 bln
-23.58%
jan 1, 1984
3.5 bln
+80.45 mln
2.35%
jan 1, 1985
4.057 bln
+556.957 mln
15.92%
jan 1, 1986
4.072 bln
+15.471 mln
0.38%
jan 1, 1987
4.301 bln
+228.971 mln
5.62%
jan 1, 1988
4.397 bln
+95.92 mln
2.23%
jan 1, 1989
4.725 bln
+327.986 mln
7.46%
jan 1, 1990
4.784 bln
+58.79 mln
1.24%
jan 1, 1991
4.647 bln
-136.145 mln
-2.85%
jan 1, 1992
4.926 bln
+278.479 mln
5.99%
jan 1, 1993
5.294 bln
+368.211 mln
7.47%
jan 1, 1994
5.669 bln
+374.399 mln
7.07%
jan 1, 1995
5.73 bln
+61.884 mln
1.09%
jan 1, 1996
5.959 bln
+228.971 mln
4.0%
jan 1, 1997
6.105 bln
+145.428 mln
2.44%
jan 1, 1998
6.018 bln
-86.638 mln
-1.42%
jan 1, 1999
6.47 bln
+451.754 mln
7.51%
jan 1, 2000
6.745 bln
+275.384 mln
4.26%
jan 1, 2001
7.002 bln
+256.819 mln
3.81%
jan 1, 2002
7.253 bln
+250.969 mln
3.58%
jan 1, 2003
7.681 bln
+428.13 mln
5.9%
jan 1, 2004
8.287 bln
+605.726 mln
7.89%
jan 1, 2005
9.627 bln
+1.34 bln
16.17%
jan 1, 2006
9.975 bln
+348.085 mln
3.62%
jan 1, 2007
10.379 bln
+404.585 mln
4.06%
jan 1, 2008
11.509 bln
+1.13 bln
10.89%
jan 1, 2009
11.783 bln
+274.02 mln
2.38%
jan 1, 2010
8.695 bln
-3.088 bln
-26.21%
jan 1, 2011
10.017 bln
+1.322 bln
15.2%
jan 1, 2012
11.286 bln
+1.269 bln
12.67%
jan 1, 2013
11.994 bln
+708.614 mln
6.28%
jan 1, 2014
11.503 bln
-491.351 mln
-4.1%
jan 1, 2015
11.67 bln
+167.257 mln
1.45%
jan 1, 2016
12.561 bln
+890.124 mln
7.63%
Ranking of countries by current statistics by years


Comments: