29
/
en
AIzaSyAYiBZKx7MnpbEhh9jyipgxe19OcubqV5w
April 1, 2024
62687
World
WLD
false
2
1
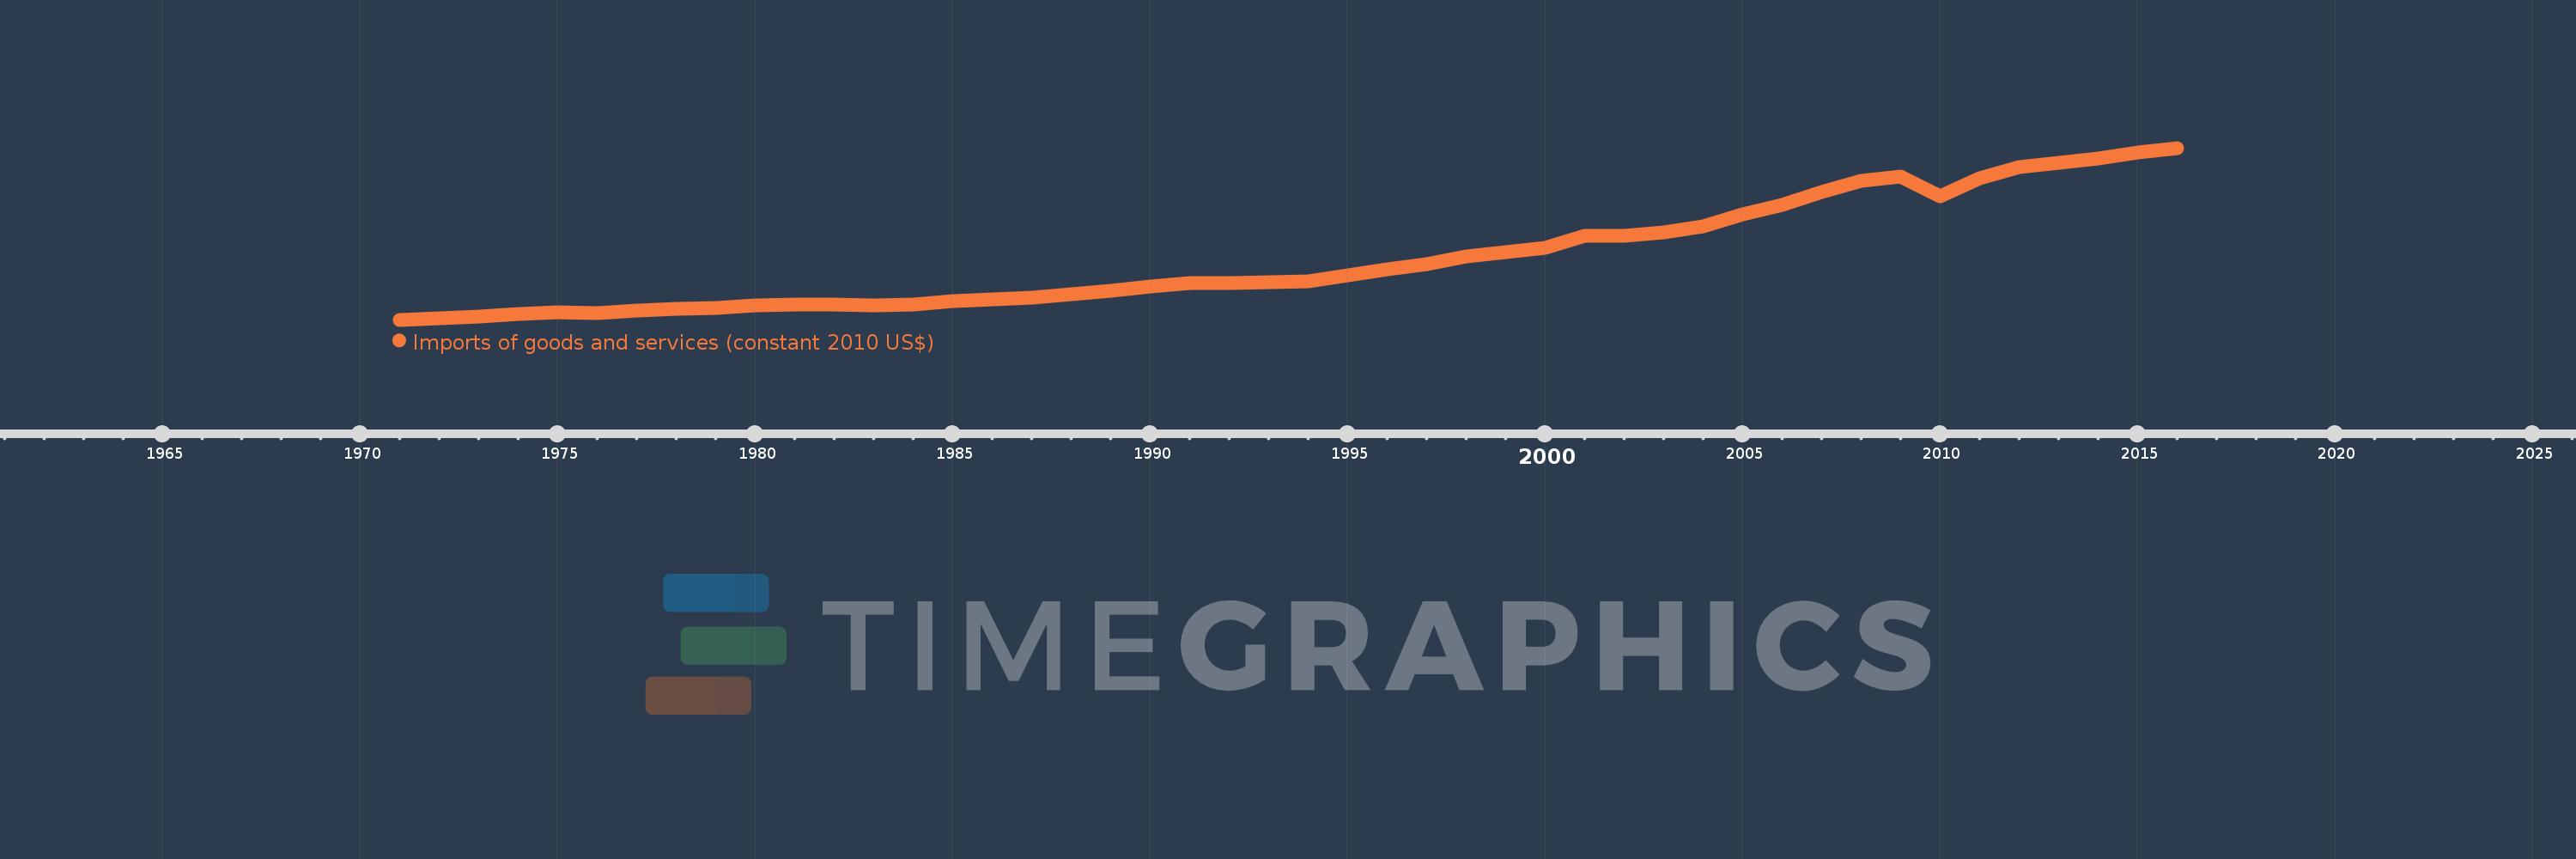
Imports of goods and services (constant 2010 US$)
2016,2015,2014,2013,2012,2011,2010,2009,2008,2007,2006,2005,2004,2003,2002,2001,2000,1999,1998,1997,1996,1995,1994,1993,1992,1991,1990,1989,1988,1987,1986,1985,1984,1983,1982,1981,1980,1979,1978,1977,1976,1975,1974,1973,1972,1971
This statistics in other country:
AfghanistanAlbaniaAlgeriaAngolaAntigua and BarbudaArab WorldArgentinaArmeniaArubaAustraliaAustriaAzerbaijanBahamas, TheBahrainBangladeshBarbadosBelarusBelgiumBelizeBeninBermudaBhutanBoliviaBosnia and HerzegovinaBotswanaBrazilBrunei DarussalamBulgariaBurkina FasoBurundiCabo VerdeCambodiaCameroonCanadaCaribbean small statesCentral African RepublicCentral Europe and the BalticsChadChileChinaColombiaComorosCongo, Dem. Rep.Congo, Rep.Costa RicaCote d'IvoireCroatiaCubaCyprusCzech RepublicDenmarkDominicaDominican RepublicEarly-demographic dividendEast Asia & PacificEast Asia & Pacific (excluding high income)East Asia & Pacific (IDA & IBRD countries)EcuadorEgypt, Arab Rep.El SalvadorEquatorial GuineaEritreaEstoniaEuro areaEurope & Central AsiaEurope & Central Asia (excluding high income)Europe & Central Asia (IDA & IBRD countries)European UnionFaroe IslandsFijiFinlandFragile and conflict affected situationsFranceGabonGambia, TheGeorgiaGermanyGhanaGreeceGrenadaGuatemalaGuineaGuinea-BissauGuyanaHaitiHeavily indebted poor countries (HIPC)High incomeHondurasHong Kong SAR, ChinaHungaryIBRD onlyIcelandIDA & IBRD totalIDA blendIDA onlyIDA totalIndiaIndonesiaIran, Islamic Rep.IraqIrelandIsraelItalyJamaicaJapanJordanKazakhstanKenyaKiribatiKorea, Rep.KosovoKuwaitKyrgyz RepublicLao PDRLate-demographic dividendLatin America & Caribbean Latin America & Caribbean (excluding high income)Latin America & the Caribbean (IDA & IBRD countries)LatviaLeast developed countries: UN classificationLebanonLiberiaLibyaLithuaniaLow & middle incomeLow incomeLower middle incomeLuxembourgMacao SAR, ChinaMacedonia, FYRMadagascarMalawiMalaysiaMaldivesMaliMaltaMauritaniaMauritiusMexicoMiddle East & North AfricaMiddle East & North Africa (excluding high income)Middle East & North Africa (IDA & IBRD countries)Middle incomeMoldovaMongoliaMontenegroMoroccoMozambiqueMyanmarNamibiaNepalNetherlandsNew ZealandNicaraguaNigerNigeriaNorth AmericaNorwayOECD membersOmanOther small statesPacific island small statesPakistanPalauPanamaParaguayPeruPhilippinesPolandPortugalPost-demographic dividendPre-demographic dividendPuerto RicoQatarRomaniaRussian FederationRwandaSamoaSaudi ArabiaSenegalSerbiaSeychellesSierra LeoneSingaporeSlovak RepublicSloveniaSmall statesSolomon IslandsSouth AfricaSouth AsiaSouth Asia (IDA & IBRD)South SudanSpainSri LankaSt. Kitts and NevisSt. LuciaSt. Vincent and the GrenadinesSub-Saharan Africa Sub-Saharan Africa (excluding high income)Sub-Saharan Africa (IDA & IBRD countries)SudanSurinameSwazilandSwedenSwitzerlandTajikistanTanzaniaThailandTimor-LesteTogoTongaTrinidad and TobagoTunisiaTurkeyTurkmenistanUgandaUkraineUnited Arab EmiratesUnited KingdomUnited StatesUpper middle incomeUruguayUzbekistanVanuatuVenezuela, RBVietnamWest Bank and GazaWorldYemen, Rep.ZambiaZimbabwe Timeline:
This timeline shows a graph from 1971 to 2016 of World. No data until 1970. Number of actual observations by date: 46.
Source name:
World Development Indicators
Source organization:
World Bank national accounts data, and OECD National Accounts data files.
Categories, topics:
Economy & Growth, Trade
Last updated:
apr 23, 2017
Indicators value changes by year
Minimum:
2.452 trl
jan 1, 1971
Maximum:
21.843 trl
jan 1, 2016
At the date of observation
Value
Absolute change
Change from previous value
jan 1, 1971
2.452 trl
+2.452 trl
0.0%
jan 1, 1972
2.586 trl
+134.035 bln
5.47%
jan 1, 1973
2.802 trl
+215.901 bln
8.35%
jan 1, 1974
3.12 trl
+318.07 bln
11.35%
jan 1, 1975
3.291 trl
+171.418 bln
5.49%
jan 1, 1976
3.163 trl
-128.051 bln
-3.89%
jan 1, 1977
3.468 trl
+305.415 bln
9.66%
jan 1, 1978
3.648 trl
+179.712 bln
5.18%
jan 1, 1979
3.78 trl
+132.218 bln
3.62%
jan 1, 1980
4.065 trl
+284.924 bln
7.54%
jan 1, 1981
4.137 trl
+71.734 bln
1.76%
jan 1, 1982
4.187 trl
+49.623 bln
1.2%
jan 1, 1983
4.1 trl
-86.365 bln
-2.06%
jan 1, 1984
4.184 trl
+84.015 bln
2.05%
jan 1, 1985
4.542 trl
+358.085 bln
8.56%
jan 1, 1986
4.709 trl
+167.122 bln
3.68%
jan 1, 1987
4.956 trl
+246.144 bln
5.23%
jan 1, 1988
5.301 trl
+345.682 bln
6.98%
jan 1, 1989
5.735 trl
+433.887 bln
8.18%
jan 1, 1990
6.217 trl
+481.746 bln
8.4%
jan 1, 1991
6.559 trl
+341.615 bln
5.49%
jan 1, 1992
6.561 trl
+2.931 bln
0.04%
jan 1, 1993
6.726 trl
+164.076 bln
2.5%
jan 1, 1994
6.827 trl
+101.326 bln
1.51%
jan 1, 1995
7.449 trl
+621.757 bln
9.11%
jan 1, 1996
8.151 trl
+701.948 bln
9.42%
jan 1, 1997
8.73 trl
+579.535 bln
7.11%
jan 1, 1998
9.577 trl
+847.078 bln
9.7%
jan 1, 1999
10.08 trl
+503.321 bln
5.26%
jan 1, 2000
10.604 trl
+523.956 bln
5.2%
jan 1, 2001
11.933 trl
+1.328 trl
12.53%
jan 1, 2002
11.971 trl
+37.583 bln
0.31%
jan 1, 2003
12.3 trl
+329.461 bln
2.75%
jan 1, 2004
12.948 trl
+648.032 bln
5.27%
jan 1, 2005
14.327 trl
+1.379 trl
10.65%
jan 1, 2006
15.455 trl
+1.128 trl
7.88%
jan 1, 2007
16.829 trl
+1.374 trl
8.89%
jan 1, 2008
18.095 trl
+1.266 trl
7.52%
jan 1, 2009
18.622 trl
+526.549 bln
2.91%
jan 1, 2010
16.395 trl
-2.227 trl
-11.96%
jan 1, 2011
18.423 trl
+2.028 trl
12.37%
jan 1, 2012
19.678 trl
+1.255 trl
6.81%
jan 1, 2013
20.161 trl
+483.22 bln
2.46%
jan 1, 2014
20.651 trl
+490.226 bln
2.43%
jan 1, 2015
21.314 trl
+662.159 bln
3.21%
jan 1, 2016
21.843 trl
+529.212 bln
2.48%
Ranking of countries by current statistics by years


Comments: