29
/
en
AIzaSyAYiBZKx7MnpbEhh9jyipgxe19OcubqV5w
April 1, 2024
224968
Poland
POL
true
2
1
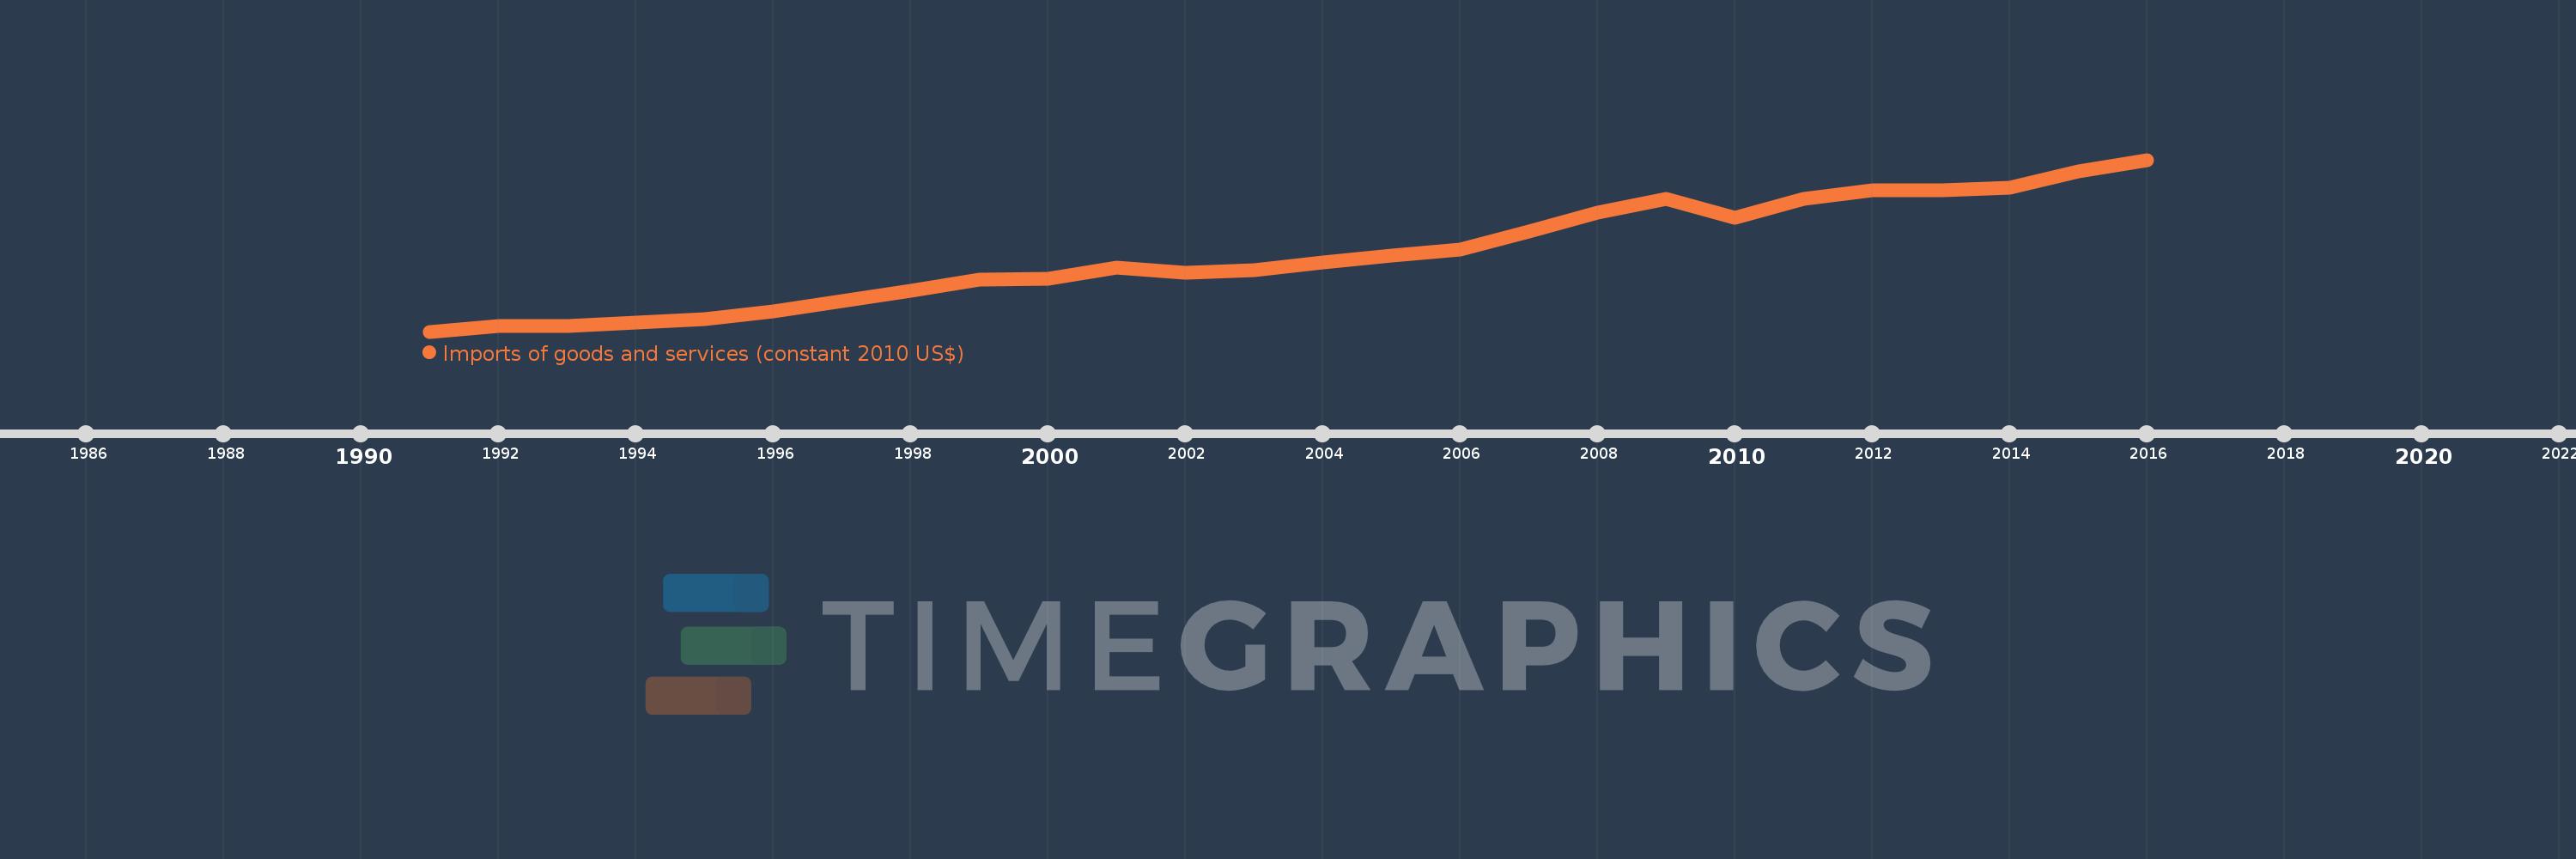
Imports of goods and services (constant 2010 US$)
2016,2015,2014,2013,2012,2011,2010,2009,2008,2007,2006,2005,2004,2003,2002,2001,2000,1999,1998,1997,1996,1995,1994,1993,1992,1991
This statistics in other country:
AfghanistanAlbaniaAlgeriaAngolaAntigua and BarbudaArab WorldArgentinaArmeniaArubaAustraliaAustriaAzerbaijanBahamas, TheBahrainBangladeshBarbadosBelarusBelgiumBelizeBeninBermudaBhutanBoliviaBosnia and HerzegovinaBotswanaBrazilBrunei DarussalamBulgariaBurkina FasoBurundiCabo VerdeCambodiaCameroonCanadaCaribbean small statesCentral African RepublicCentral Europe and the BalticsChadChileChinaColombiaComorosCongo, Dem. Rep.Congo, Rep.Costa RicaCote d'IvoireCroatiaCubaCyprusCzech RepublicDenmarkDominicaDominican RepublicEarly-demographic dividendEast Asia & PacificEast Asia & Pacific (excluding high income)East Asia & Pacific (IDA & IBRD countries)EcuadorEgypt, Arab Rep.El SalvadorEquatorial GuineaEritreaEstoniaEuro areaEurope & Central AsiaEurope & Central Asia (excluding high income)Europe & Central Asia (IDA & IBRD countries)European UnionFaroe IslandsFijiFinlandFragile and conflict affected situationsFranceGabonGambia, TheGeorgiaGermanyGhanaGreeceGrenadaGuatemalaGuineaGuinea-BissauGuyanaHaitiHeavily indebted poor countries (HIPC)High incomeHondurasHong Kong SAR, ChinaHungaryIBRD onlyIcelandIDA & IBRD totalIDA blendIDA onlyIDA totalIndiaIndonesiaIran, Islamic Rep.IraqIrelandIsraelItalyJamaicaJapanJordanKazakhstanKenyaKiribatiKorea, Rep.KosovoKuwaitKyrgyz RepublicLao PDRLate-demographic dividendLatin America & Caribbean Latin America & Caribbean (excluding high income)Latin America & the Caribbean (IDA & IBRD countries)LatviaLeast developed countries: UN classificationLebanonLiberiaLibyaLithuaniaLow & middle incomeLow incomeLower middle incomeLuxembourgMacao SAR, ChinaMacedonia, FYRMadagascarMalawiMalaysiaMaldivesMaliMaltaMauritaniaMauritiusMexicoMiddle East & North AfricaMiddle East & North Africa (excluding high income)Middle East & North Africa (IDA & IBRD countries)Middle incomeMoldovaMongoliaMontenegroMoroccoMozambiqueMyanmarNamibiaNepalNetherlandsNew ZealandNicaraguaNigerNigeriaNorth AmericaNorwayOECD membersOmanOther small statesPacific island small statesPakistanPalauPanamaParaguayPeruPhilippinesPolandPortugalPost-demographic dividendPre-demographic dividendPuerto RicoQatarRomaniaRussian FederationRwandaSamoaSaudi ArabiaSenegalSerbiaSeychellesSierra LeoneSingaporeSlovak RepublicSloveniaSmall statesSolomon IslandsSouth AfricaSouth AsiaSouth Asia (IDA & IBRD)South SudanSpainSri LankaSt. Kitts and NevisSt. LuciaSt. Vincent and the GrenadinesSub-Saharan Africa Sub-Saharan Africa (excluding high income)Sub-Saharan Africa (IDA & IBRD countries)SudanSurinameSwazilandSwedenSwitzerlandTajikistanTanzaniaThailandTimor-LesteTogoTongaTrinidad and TobagoTunisiaTurkeyTurkmenistanUgandaUkraineUnited Arab EmiratesUnited KingdomUnited StatesUpper middle incomeUruguayUzbekistanVanuatuVenezuela, RBVietnamWest Bank and GazaWorldYemen, Rep.ZambiaZimbabwe Timeline:
This timeline shows a graph from 1991 to 2016 of Poland. No data until 1990. Number of actual observations by date: 26.
Source name:
World Development Indicators
Source organization:
World Bank national accounts data, and OECD National Accounts data files.
Categories, topics:
Economy & Growth, Trade
Last updated:
apr 23, 2017
Indicators value changes by year
Minimum:
24.847 bln
jan 1, 1991
Maximum:
253.637 bln
jan 1, 2016
At the date of observation
Value
Absolute change
Change from previous value
jan 1, 1991
24.847 bln
+24.847 bln
0.0%
jan 1, 1992
32.221 bln
+7.374 bln
29.68%
jan 1, 1993
32.785 bln
+564.385 mln
1.75%
jan 1, 1994
37.095 bln
+4.31 bln
13.15%
jan 1, 1995
41.302 bln
+4.207 bln
11.34%
jan 1, 1996
51.307 bln
+10.005 bln
24.22%
jan 1, 1997
65.275 bln
+13.969 bln
27.23%
jan 1, 1998
79.168 bln
+13.893 bln
21.28%
jan 1, 1999
93.859 bln
+14.691 bln
18.56%
jan 1, 2000
94.863 bln
+1.005 bln
1.07%
jan 1, 2001
109.551 bln
+14.687 bln
15.48%
jan 1, 2002
103.774 bln
-5.777 bln
-5.27%
jan 1, 2003
106.661 bln
+2.887 bln
2.78%
jan 1, 2004
116.912 bln
+10.251 bln
9.61%
jan 1, 2005
126.402 bln
+9.489 bln
8.12%
jan 1, 2006
134.318 bln
+7.917 bln
6.26%
jan 1, 2007
158.655 bln
+24.337 bln
18.12%
jan 1, 2008
183.705 bln
+25.049 bln
15.79%
jan 1, 2009
201.205 bln
+17.5 bln
9.53%
jan 1, 2010
176.288 bln
-24.917 bln
-12.38%
jan 1, 2011
201.57 bln
+25.282 bln
14.34%
jan 1, 2012
213.279 bln
+11.709 bln
5.81%
jan 1, 2013
212.693 bln
-586.749 mln
-0.28%
jan 1, 2014
216.268 bln
+3.576 bln
1.68%
jan 1, 2015
237.916 bln
+21.647 bln
10.01%
jan 1, 2016
253.637 bln
+15.721 bln
6.61%
Ranking of countries by current statistics by years


Comments: