29
/
en
AIzaSyAYiBZKx7MnpbEhh9jyipgxe19OcubqV5w
April 1, 2024
84219
Benin
BEN
true
2
1
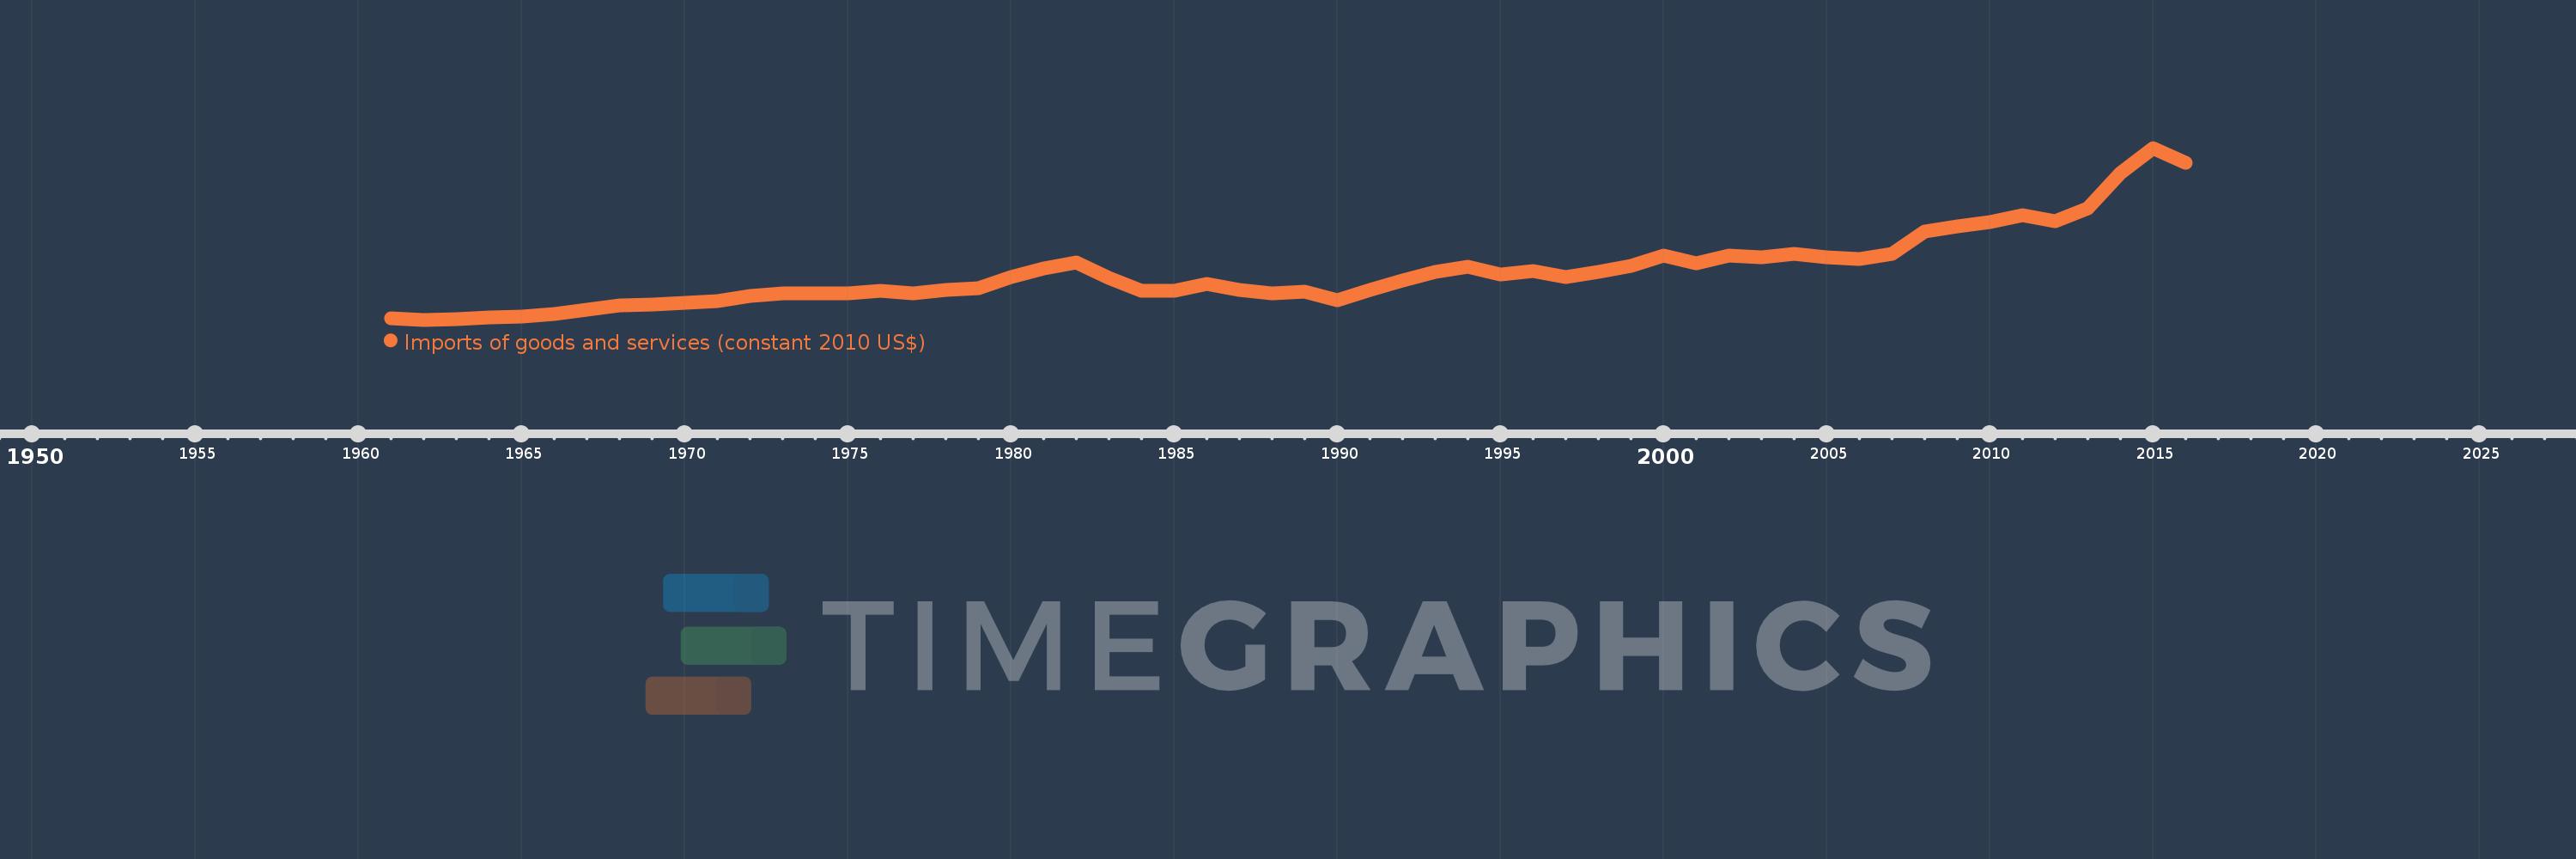
Imports of goods and services (constant 2010 US$)
2016,2015,2014,2013,2012,2011,2010,2009,2008,2007,2006,2005,2004,2003,2002,2001,2000,1999,1998,1997,1996,1995,1994,1993,1992,1991,1990,1989,1988,1987,1986,1985,1984,1983,1982,1981,1980,1979,1978,1977,1976,1975,1974,1973,1972,1971,1970,1969,1968,1967,1966,1965,1964,1963,1962,1961
This statistics in other country:
AfghanistanAlbaniaAlgeriaAngolaAntigua and BarbudaArab WorldArgentinaArmeniaArubaAustraliaAustriaAzerbaijanBahamas, TheBahrainBangladeshBarbadosBelarusBelgiumBelizeBeninBermudaBhutanBoliviaBosnia and HerzegovinaBotswanaBrazilBrunei DarussalamBulgariaBurkina FasoBurundiCabo VerdeCambodiaCameroonCanadaCaribbean small statesCentral African RepublicCentral Europe and the BalticsChadChileChinaColombiaComorosCongo, Dem. Rep.Congo, Rep.Costa RicaCote d'IvoireCroatiaCubaCyprusCzech RepublicDenmarkDominicaDominican RepublicEarly-demographic dividendEast Asia & PacificEast Asia & Pacific (excluding high income)East Asia & Pacific (IDA & IBRD countries)EcuadorEgypt, Arab Rep.El SalvadorEquatorial GuineaEritreaEstoniaEuro areaEurope & Central AsiaEurope & Central Asia (excluding high income)Europe & Central Asia (IDA & IBRD countries)European UnionFaroe IslandsFijiFinlandFragile and conflict affected situationsFranceGabonGambia, TheGeorgiaGermanyGhanaGreeceGrenadaGuatemalaGuineaGuinea-BissauGuyanaHaitiHeavily indebted poor countries (HIPC)High incomeHondurasHong Kong SAR, ChinaHungaryIBRD onlyIcelandIDA & IBRD totalIDA blendIDA onlyIDA totalIndiaIndonesiaIran, Islamic Rep.IraqIrelandIsraelItalyJamaicaJapanJordanKazakhstanKenyaKiribatiKorea, Rep.KosovoKuwaitKyrgyz RepublicLao PDRLate-demographic dividendLatin America & Caribbean Latin America & Caribbean (excluding high income)Latin America & the Caribbean (IDA & IBRD countries)LatviaLeast developed countries: UN classificationLebanonLiberiaLibyaLithuaniaLow & middle incomeLow incomeLower middle incomeLuxembourgMacao SAR, ChinaMacedonia, FYRMadagascarMalawiMalaysiaMaldivesMaliMaltaMauritaniaMauritiusMexicoMiddle East & North AfricaMiddle East & North Africa (excluding high income)Middle East & North Africa (IDA & IBRD countries)Middle incomeMoldovaMongoliaMontenegroMoroccoMozambiqueMyanmarNamibiaNepalNetherlandsNew ZealandNicaraguaNigerNigeriaNorth AmericaNorwayOECD membersOmanOther small statesPacific island small statesPakistanPalauPanamaParaguayPeruPhilippinesPolandPortugalPost-demographic dividendPre-demographic dividendPuerto RicoQatarRomaniaRussian FederationRwandaSamoaSaudi ArabiaSenegalSerbiaSeychellesSierra LeoneSingaporeSlovak RepublicSloveniaSmall statesSolomon IslandsSouth AfricaSouth AsiaSouth Asia (IDA & IBRD)South SudanSpainSri LankaSt. Kitts and NevisSt. LuciaSt. Vincent and the GrenadinesSub-Saharan Africa Sub-Saharan Africa (excluding high income)Sub-Saharan Africa (IDA & IBRD countries)SudanSurinameSwazilandSwedenSwitzerlandTajikistanTanzaniaThailandTimor-LesteTogoTongaTrinidad and TobagoTunisiaTurkeyTurkmenistanUgandaUkraineUnited Arab EmiratesUnited KingdomUnited StatesUpper middle incomeUruguayUzbekistanVanuatuVenezuela, RBVietnamWest Bank and GazaWorldYemen, Rep.ZambiaZimbabwe Timeline:
This timeline shows a graph from 1961 to 2016 of Benin. No data until 1960. Number of actual observations by date: 56.
Source name:
World Development Indicators
Source organization:
World Bank national accounts data, and OECD National Accounts data files.
Categories, topics:
Economy & Growth, Trade
Last updated:
apr 23, 2017
Indicators value changes by year
Minimum:
169.169 mln
jan 1, 1962
Maximum:
4.138 bln
jan 1, 2015
At the date of observation
Value
Absolute change
Change from previous value
jan 1, 1961
208.898 mln
+208.898 mln
0.0%
jan 1, 1962
169.169 mln
-39.729 mln
-19.02%
jan 1, 1963
176.857 mln
+7.688 mln
4.54%
jan 1, 1964
220.431 mln
+43.574 mln
24.64%
jan 1, 1965
240.937 mln
+20.505 mln
9.3%
jan 1, 1966
306.295 mln
+65.359 mln
27.13%
jan 1, 1967
393.442 mln
+87.147 mln
28.45%
jan 1, 1968
490.841 mln
+97.399 mln
24.76%
jan 1, 1969
517.753 mln
+26.912 mln
5.48%
jan 1, 1970
562.607 mln
+44.854 mln
8.66%
jan 1, 1971
608.746 mln
+46.139 mln
8.2%
jan 1, 1972
728.313 mln
+119.567 mln
19.64%
jan 1, 1973
785.977 mln
+57.664 mln
7.92%
jan 1, 1974
776.101 mln
-9.876 mln
-1.26%
jan 1, 1975
785.659 mln
+9.558 mln
1.23%
jan 1, 1976
833.442 mln
+47.783 mln
6.08%
jan 1, 1977
778.566 mln
-54.875 mln
-6.58%
jan 1, 1978
852.666 mln
+74.1 mln
9.52%
jan 1, 1979
901.42 mln
+48.754 mln
5.72%
jan 1, 1980
1.149 bln
+247.75 mln
27.48%
jan 1, 1981
1.356 bln
+206.506 mln
17.97%
jan 1, 1982
1.484 bln
+128.009 mln
9.44%
jan 1, 1983
1.138 bln
-345.642 mln
-23.3%
jan 1, 1984
841.704 mln
-296.34 mln
-26.04%
jan 1, 1985
842.7 mln
+996.119K
0.12%
jan 1, 1986
994.107 mln
+151.407 mln
17.97%
jan 1, 1987
859.758 mln
-134.349 mln
-13.51%
jan 1, 1988
788.154 mln
-71.605 mln
-8.33%
jan 1, 1989
814.014 mln
+25.861 mln
3.28%
jan 1, 1990
626.452 mln
-187.562 mln
-23.04%
jan 1, 1991
848.031 mln
+221.579 mln
35.37%
jan 1, 1992
1.071 bln
+222.638 mln
26.25%
jan 1, 1993
1.277 bln
+206.512 mln
19.29%
jan 1, 1994
1.384 bln
+106.495 mln
8.34%
jan 1, 1995
1.219 bln
-164.774 mln
-11.91%
jan 1, 1996
1.286 bln
+67.114 mln
5.51%
jan 1, 1997
1.151 bln
-134.552 mln
-10.46%
jan 1, 1998
1.283 bln
+131.672 mln
11.44%
jan 1, 1999
1.41 bln
+126.748 mln
9.88%
jan 1, 2000
1.644 bln
+234.204 mln
16.61%
jan 1, 2001
1.467 bln
-177.267 mln
-10.78%
jan 1, 2002
1.647 bln
+179.887 mln
12.26%
jan 1, 2003
1.611 bln
-35.803 mln
-2.17%
jan 1, 2004
1.695 bln
+84.267 mln
5.23%
jan 1, 2005
1.608 bln
-86.887 mln
-5.13%
jan 1, 2006
1.574 bln
-34.056 mln
-2.12%
jan 1, 2007
1.685 bln
+110.683 mln
7.03%
jan 1, 2008
2.2 bln
+514.773 mln
30.55%
jan 1, 2009
2.325 bln
+125.746 mln
5.72%
jan 1, 2010
2.423 bln
+98.021 mln
4.22%
jan 1, 2011
2.593 bln
+169.845 mln
7.01%
jan 1, 2012
2.442 bln
-151.07 mln
-5.83%
jan 1, 2013
2.742 bln
+299.52 mln
12.26%
jan 1, 2014
3.563 bln
+821.28 mln
29.95%
jan 1, 2015
4.138 bln
+574.59 mln
16.13%
jan 1, 2016
3.79 bln
-347.33 mln
-8.39%
Ranking of countries by current statistics by years


Comments: