29
/
en
AIzaSyAYiBZKx7MnpbEhh9jyipgxe19OcubqV5w
April 1, 2024
266961
Trinidad and Tobago
TTO
true
2
1
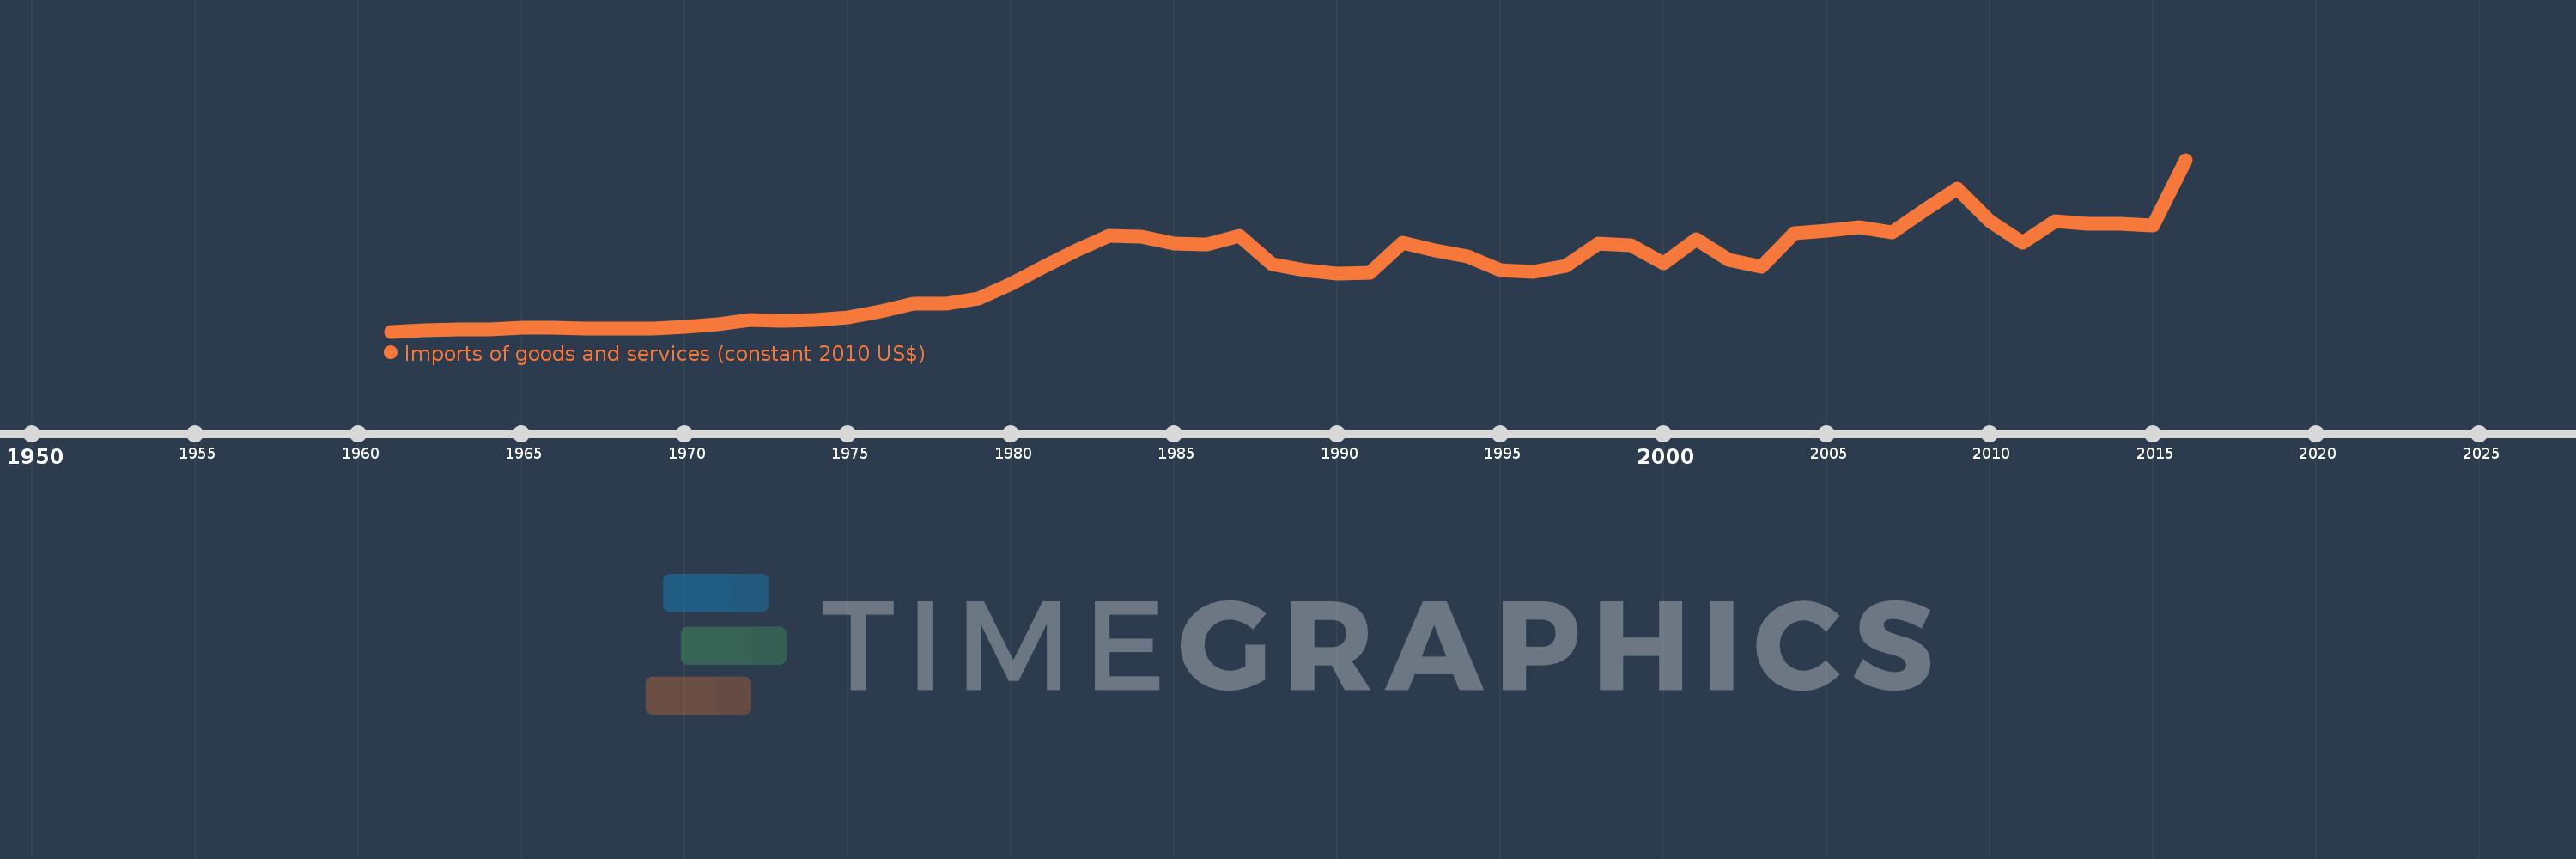
Imports of goods and services (constant 2010 US$)
2016,2015,2014,2013,2012,2011,2010,2009,2008,2007,2006,2005,2004,2003,2002,2001,2000,1999,1998,1997,1996,1995,1994,1993,1992,1991,1990,1989,1988,1987,1986,1985,1984,1983,1982,1981,1980,1979,1978,1977,1976,1975,1974,1973,1972,1971,1970,1969,1968,1967,1966,1965,1964,1963,1962,1961
This statistics in other country:
AfghanistanAlbaniaAlgeriaAngolaAntigua and BarbudaArab WorldArgentinaArmeniaArubaAustraliaAustriaAzerbaijanBahamas, TheBahrainBangladeshBarbadosBelarusBelgiumBelizeBeninBermudaBhutanBoliviaBosnia and HerzegovinaBotswanaBrazilBrunei DarussalamBulgariaBurkina FasoBurundiCabo VerdeCambodiaCameroonCanadaCaribbean small statesCentral African RepublicCentral Europe and the BalticsChadChileChinaColombiaComorosCongo, Dem. Rep.Congo, Rep.Costa RicaCote d'IvoireCroatiaCubaCyprusCzech RepublicDenmarkDominicaDominican RepublicEarly-demographic dividendEast Asia & PacificEast Asia & Pacific (excluding high income)East Asia & Pacific (IDA & IBRD countries)EcuadorEgypt, Arab Rep.El SalvadorEquatorial GuineaEritreaEstoniaEuro areaEurope & Central AsiaEurope & Central Asia (excluding high income)Europe & Central Asia (IDA & IBRD countries)European UnionFaroe IslandsFijiFinlandFragile and conflict affected situationsFranceGabonGambia, TheGeorgiaGermanyGhanaGreeceGrenadaGuatemalaGuineaGuinea-BissauGuyanaHaitiHeavily indebted poor countries (HIPC)High incomeHondurasHong Kong SAR, ChinaHungaryIBRD onlyIcelandIDA & IBRD totalIDA blendIDA onlyIDA totalIndiaIndonesiaIran, Islamic Rep.IraqIrelandIsraelItalyJamaicaJapanJordanKazakhstanKenyaKiribatiKorea, Rep.KosovoKuwaitKyrgyz RepublicLao PDRLate-demographic dividendLatin America & Caribbean Latin America & Caribbean (excluding high income)Latin America & the Caribbean (IDA & IBRD countries)LatviaLeast developed countries: UN classificationLebanonLiberiaLibyaLithuaniaLow & middle incomeLow incomeLower middle incomeLuxembourgMacao SAR, ChinaMacedonia, FYRMadagascarMalawiMalaysiaMaldivesMaliMaltaMauritaniaMauritiusMexicoMiddle East & North AfricaMiddle East & North Africa (excluding high income)Middle East & North Africa (IDA & IBRD countries)Middle incomeMoldovaMongoliaMontenegroMoroccoMozambiqueMyanmarNamibiaNepalNetherlandsNew ZealandNicaraguaNigerNigeriaNorth AmericaNorwayOECD membersOmanOther small statesPacific island small statesPakistanPalauPanamaParaguayPeruPhilippinesPolandPortugalPost-demographic dividendPre-demographic dividendPuerto RicoQatarRomaniaRussian FederationRwandaSamoaSaudi ArabiaSenegalSerbiaSeychellesSierra LeoneSingaporeSlovak RepublicSloveniaSmall statesSolomon IslandsSouth AfricaSouth AsiaSouth Asia (IDA & IBRD)South SudanSpainSri LankaSt. Kitts and NevisSt. LuciaSt. Vincent and the GrenadinesSub-Saharan Africa Sub-Saharan Africa (excluding high income)Sub-Saharan Africa (IDA & IBRD countries)SudanSurinameSwazilandSwedenSwitzerlandTajikistanTanzaniaThailandTimor-LesteTogoTongaTrinidad and TobagoTunisiaTurkeyTurkmenistanUgandaUkraineUnited Arab EmiratesUnited KingdomUnited StatesUpper middle incomeUruguayUzbekistanVanuatuVenezuela, RBVietnamWest Bank and GazaWorldYemen, Rep.ZambiaZimbabwe Timeline:
This timeline shows a graph from 1961 to 2016 of Trinidad and Tobago. No data until 1960. Number of actual observations by date: 56.
Source name:
World Development Indicators
Source organization:
World Bank national accounts data, and OECD National Accounts data files.
Categories, topics:
Economy & Growth, Trade
Last updated:
apr 23, 2017
Indicators value changes by year
Minimum:
711.35 mln
jan 1, 1961
Maximum:
12.685 bln
jan 1, 2016
At the date of observation
Value
Absolute change
Change from previous value
jan 1, 1961
711.35 mln
+711.35 mln
0.0%
jan 1, 1962
817.872 mln
+106.523 mln
14.97%
jan 1, 1963
852.175 mln
+34.303 mln
4.19%
jan 1, 1964
872.035 mln
+19.86 mln
2.33%
jan 1, 1965
967.725 mln
+95.69 mln
10.97%
jan 1, 1966
1.001 bln
+32.777 mln
3.39%
jan 1, 1967
905.873 mln
-94.629 mln
-9.46%
jan 1, 1968
901.719 mln
-4.154 mln
-0.46%
jan 1, 1969
922.849 mln
+21.13 mln
2.34%
jan 1, 1970
1.069 bln
+146.644 mln
15.89%
jan 1, 1971
1.237 bln
+167.413 mln
15.65%
jan 1, 1972
1.523 bln
+286.065 mln
23.13%
jan 1, 1973
1.482 bln
-40.815 mln
-2.68%
jan 1, 1974
1.517 bln
+34.855 mln
2.35%
jan 1, 1975
1.691 bln
+173.553 mln
11.44%
jan 1, 1976
2.11 bln
+419.165 mln
24.79%
jan 1, 1977
2.657 bln
+547.388 mln
25.95%
jan 1, 1978
2.672 bln
+15.351 mln
0.58%
jan 1, 1979
3.006 bln
+333.562 mln
12.48%
jan 1, 1980
4.011 bln
+1.005 bln
33.42%
jan 1, 1981
5.258 bln
+1.247 bln
31.1%
jan 1, 1982
6.343 bln
+1.085 bln
20.63%
jan 1, 1983
7.407 bln
+1.064 bln
16.78%
jan 1, 1984
7.319 bln
-88.571 mln
-1.2%
jan 1, 1985
6.846 bln
-472.888 mln
-6.46%
jan 1, 1986
6.795 bln
-50.262 mln
-0.73%
jan 1, 1987
7.366 bln
+570.959 mln
8.4%
jan 1, 1988
5.431 bln
-1.935 bln
-26.27%
jan 1, 1989
4.992 bln
-438.563 mln
-8.08%
jan 1, 1990
4.73 bln
-262.341 mln
-5.25%
jan 1, 1991
4.822 bln
+92.248 mln
1.95%
jan 1, 1992
6.887 bln
+2.064 bln
42.81%
jan 1, 1993
6.396 bln
-490.663 mln
-7.12%
jan 1, 1994
5.937 bln
-459.096 mln
-7.18%
jan 1, 1995
4.999 bln
-938.113 mln
-15.8%
jan 1, 1996
4.851 bln
-148.248 mln
-2.97%
jan 1, 1997
5.305 bln
+454.585 mln
9.37%
jan 1, 1998
6.83 bln
+1.525 bln
28.75%
jan 1, 1999
6.72 bln
-110.058 mln
-1.61%
jan 1, 2000
5.445 bln
-1.275 bln
-18.97%
jan 1, 2001
7.137 bln
+1.692 bln
31.06%
jan 1, 2002
5.688 bln
-1.449 bln
-20.31%
jan 1, 2003
5.213 bln
-475.072 mln
-8.35%
jan 1, 2004
7.576 bln
+2.363 bln
45.34%
jan 1, 2005
7.765 bln
+188.768 mln
2.49%
jan 1, 2006
7.981 bln
+216.418 mln
2.79%
jan 1, 2007
7.624 bln
-357.147 mln
-4.47%
jan 1, 2008
9.169 bln
+1.545 bln
20.27%
jan 1, 2009
10.658 bln
+1.489 bln
16.24%
jan 1, 2010
8.389 bln
-2.269 bln
-21.29%
jan 1, 2011
6.89 bln
-1.499 bln
-17.87%
jan 1, 2012
8.431 bln
+1.541 bln
22.37%
jan 1, 2013
8.229 bln
-201.686 mln
-2.39%
jan 1, 2014
8.224 bln
-5.046 mln
-0.06%
jan 1, 2015
8.131 bln
-93.552 mln
-1.14%
jan 1, 2016
12.685 bln
+4.554 bln
56.01%
Ranking of countries by current statistics by years


Comments: