29
/
en
AIzaSyAYiBZKx7MnpbEhh9jyipgxe19OcubqV5w
April 1, 2024
76280
Bahamas, The
BHS
true
2
1
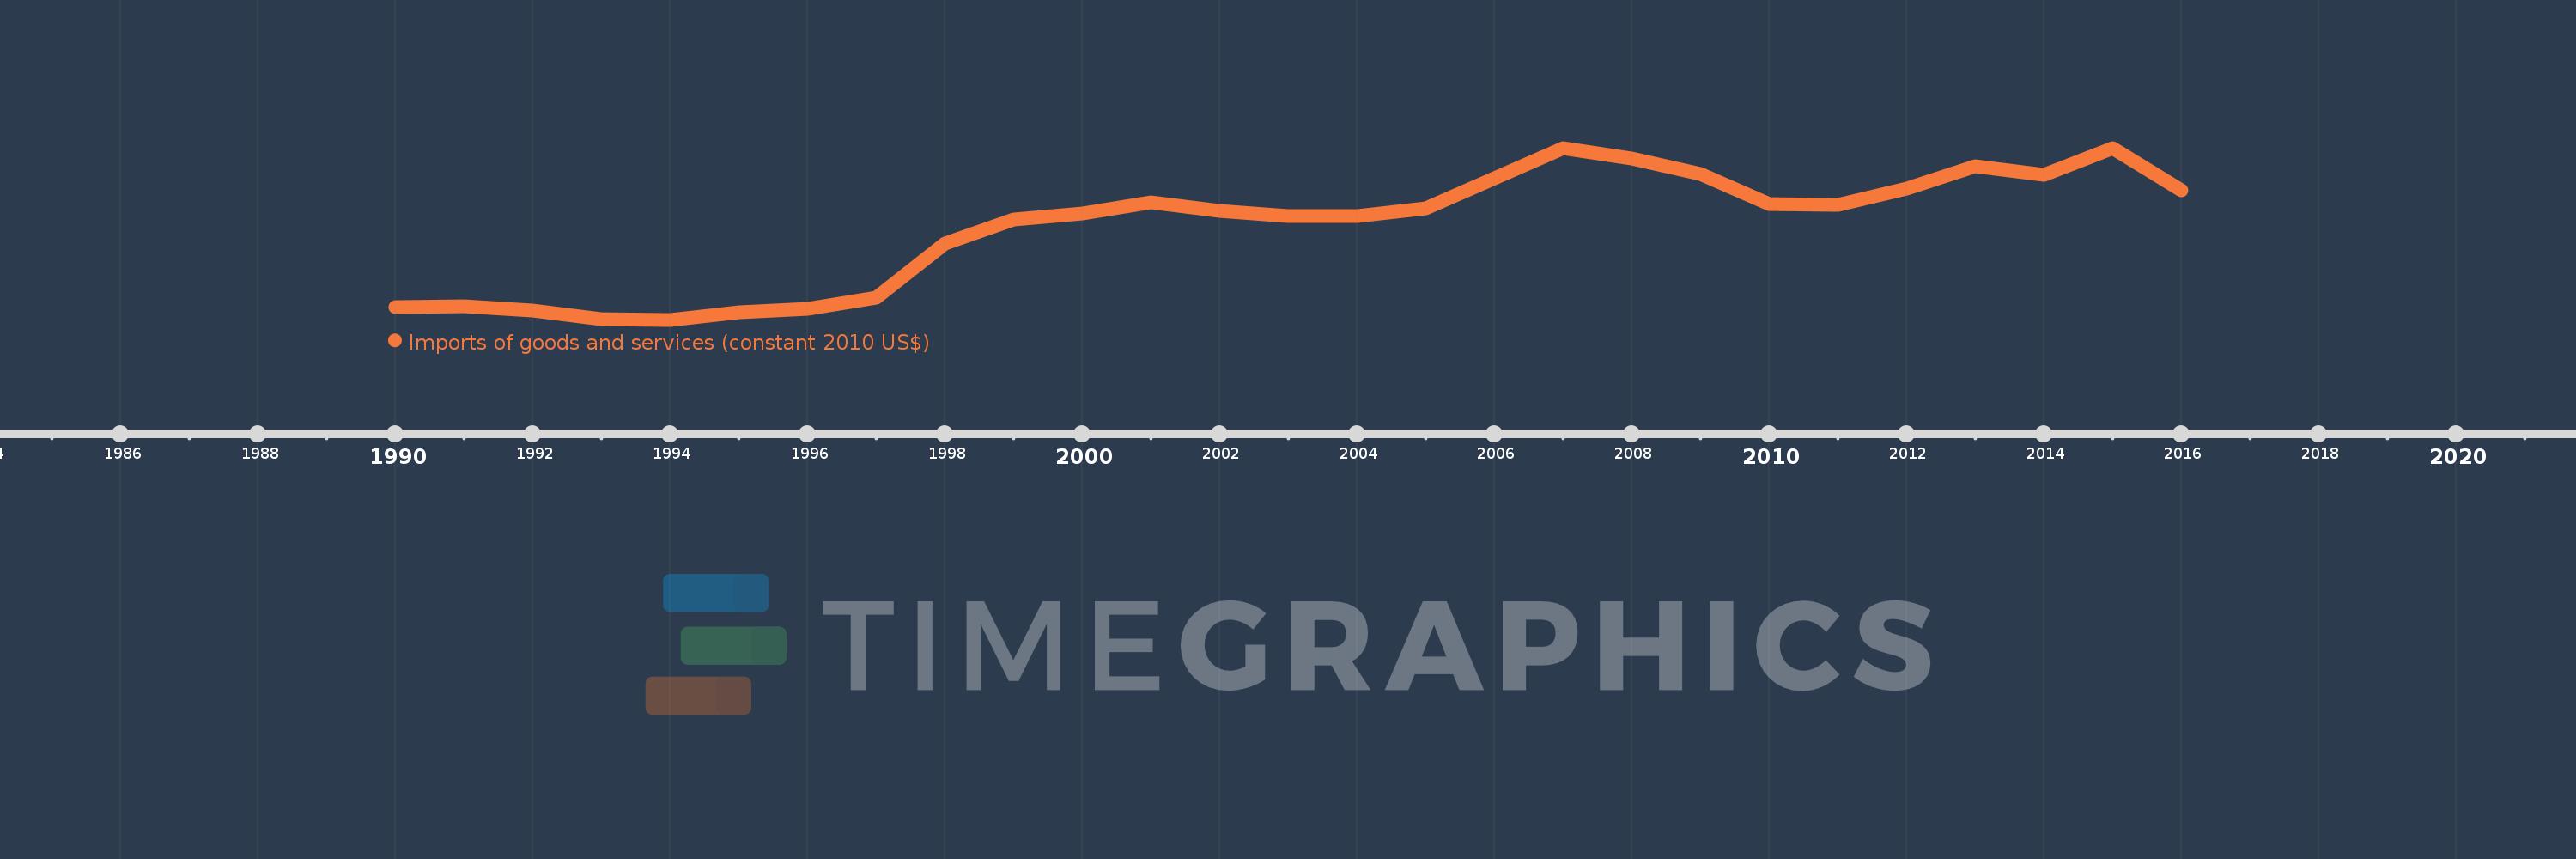
Imports of goods and services (constant 2010 US$)
2016,2015,2014,2013,2012,2011,2010,2009,2008,2007,2006,2005,2004,2003,2002,2001,2000,1999,1998,1997,1996,1995,1994,1993,1992,1991,1990
This statistics in other country:
AfghanistanAlbaniaAlgeriaAngolaAntigua and BarbudaArab WorldArgentinaArmeniaArubaAustraliaAustriaAzerbaijanBahamas, TheBahrainBangladeshBarbadosBelarusBelgiumBelizeBeninBermudaBhutanBoliviaBosnia and HerzegovinaBotswanaBrazilBrunei DarussalamBulgariaBurkina FasoBurundiCabo VerdeCambodiaCameroonCanadaCaribbean small statesCentral African RepublicCentral Europe and the BalticsChadChileChinaColombiaComorosCongo, Dem. Rep.Congo, Rep.Costa RicaCote d'IvoireCroatiaCubaCyprusCzech RepublicDenmarkDominicaDominican RepublicEarly-demographic dividendEast Asia & PacificEast Asia & Pacific (excluding high income)East Asia & Pacific (IDA & IBRD countries)EcuadorEgypt, Arab Rep.El SalvadorEquatorial GuineaEritreaEstoniaEuro areaEurope & Central AsiaEurope & Central Asia (excluding high income)Europe & Central Asia (IDA & IBRD countries)European UnionFaroe IslandsFijiFinlandFragile and conflict affected situationsFranceGabonGambia, TheGeorgiaGermanyGhanaGreeceGrenadaGuatemalaGuineaGuinea-BissauGuyanaHaitiHeavily indebted poor countries (HIPC)High incomeHondurasHong Kong SAR, ChinaHungaryIBRD onlyIcelandIDA & IBRD totalIDA blendIDA onlyIDA totalIndiaIndonesiaIran, Islamic Rep.IraqIrelandIsraelItalyJamaicaJapanJordanKazakhstanKenyaKiribatiKorea, Rep.KosovoKuwaitKyrgyz RepublicLao PDRLate-demographic dividendLatin America & Caribbean Latin America & Caribbean (excluding high income)Latin America & the Caribbean (IDA & IBRD countries)LatviaLeast developed countries: UN classificationLebanonLiberiaLibyaLithuaniaLow & middle incomeLow incomeLower middle incomeLuxembourgMacao SAR, ChinaMacedonia, FYRMadagascarMalawiMalaysiaMaldivesMaliMaltaMauritaniaMauritiusMexicoMiddle East & North AfricaMiddle East & North Africa (excluding high income)Middle East & North Africa (IDA & IBRD countries)Middle incomeMoldovaMongoliaMontenegroMoroccoMozambiqueMyanmarNamibiaNepalNetherlandsNew ZealandNicaraguaNigerNigeriaNorth AmericaNorwayOECD membersOmanOther small statesPacific island small statesPakistanPalauPanamaParaguayPeruPhilippinesPolandPortugalPost-demographic dividendPre-demographic dividendPuerto RicoQatarRomaniaRussian FederationRwandaSamoaSaudi ArabiaSenegalSerbiaSeychellesSierra LeoneSingaporeSlovak RepublicSloveniaSmall statesSolomon IslandsSouth AfricaSouth AsiaSouth Asia (IDA & IBRD)South SudanSpainSri LankaSt. Kitts and NevisSt. LuciaSt. Vincent and the GrenadinesSub-Saharan Africa Sub-Saharan Africa (excluding high income)Sub-Saharan Africa (IDA & IBRD countries)SudanSurinameSwazilandSwedenSwitzerlandTajikistanTanzaniaThailandTimor-LesteTogoTongaTrinidad and TobagoTunisiaTurkeyTurkmenistanUgandaUkraineUnited Arab EmiratesUnited KingdomUnited StatesUpper middle incomeUruguayUzbekistanVanuatuVenezuela, RBVietnamWest Bank and GazaWorldYemen, Rep.ZambiaZimbabwe Timeline:
This timeline shows a graph from 1990 to 2016 of Bahamas, The. No data until 1989. Number of actual observations by date: 27.
Source name:
World Development Indicators
Source organization:
World Bank national accounts data, and OECD National Accounts data files.
Categories, topics:
Economy & Growth, Trade
Last updated:
apr 23, 2017
Indicators value changes by year
Minimum:
1.833 bln
jan 1, 1994
Maximum:
4.917 bln
jan 1, 2015
At the date of observation
Value
Absolute change
Change from previous value
jan 1, 1990
2.065 bln
+2.065 bln
0.0%
jan 1, 1991
2.073 bln
+8.507 mln
0.41%
jan 1, 1992
1.994 bln
-79.48 mln
-3.83%
jan 1, 1993
1.848 bln
-145.758 mln
-7.31%
jan 1, 1994
1.833 bln
-15.219 mln
-0.82%
jan 1, 1995
1.966 bln
+133.199 mln
7.27%
jan 1, 1996
2.026 bln
+59.83 mln
3.04%
jan 1, 1997
2.233 bln
+206.784 mln
10.21%
jan 1, 1998
3.201 bln
+968.525 mln
43.38%
jan 1, 1999
3.63 bln
+428.288 mln
13.38%
jan 1, 2000
3.737 bln
+107.904 mln
2.97%
jan 1, 2001
3.942 bln
+204.939 mln
5.48%
jan 1, 2002
3.794 bln
-148.874 mln
-3.78%
jan 1, 2003
3.688 bln
-105.134 mln
-2.77%
jan 1, 2004
3.701 bln
+12.559 mln
0.34%
jan 1, 2005
3.832 bln
+131.019 mln
3.54%
jan 1, 2006
4.379 bln
+547.116 mln
14.28%
jan 1, 2007
4.914 bln
+534.601 mln
12.21%
jan 1, 2008
4.733 bln
-181.022 mln
-3.68%
jan 1, 2009
4.454 bln
-279.103 mln
-5.9%
jan 1, 2010
3.91 bln
-543.734 mln
-12.21%
jan 1, 2011
3.895 bln
-15.307 mln
-0.39%
jan 1, 2012
4.185 bln
+290.739 mln
7.47%
jan 1, 2013
4.59 bln
+404.77 mln
9.67%
jan 1, 2014
4.439 bln
-150.614 mln
-3.28%
jan 1, 2015
4.917 bln
+477.288 mln
10.75%
jan 1, 2016
4.152 bln
-764.606 mln
-15.55%
Ranking of countries by current statistics by years


Comments: