29
/
en
AIzaSyAYiBZKx7MnpbEhh9jyipgxe19OcubqV5w
April 1, 2024
73931
Austria
AUT
true
2
1
GNI growth (annual %)
2016,2015,2014,2013,2012,2011,2010,2009,2008,2007,2006,2005,2004,2003,2002,2001,2000,1999,1998,1997,1996,1995,1994,1993,1992,1991,1990,1989,1988,1987,1986,1985,1984,1983,1982,1981,1980,1979,1978,1977,1976,1975,1974,1973,1972,1971,1970,1969,1968,1967,1966,1965,1964,1963,1962
This statistics in other country:
AlbaniaAlgeriaAngolaAntigua and BarbudaArab WorldArgentinaArmeniaAustraliaAustriaAzerbaijanBahamas, TheBahrainBangladeshBarbadosBelarusBelgiumBelizeBeninBhutanBoliviaBosnia and HerzegovinaBotswanaBrazilBrunei DarussalamBulgariaBurkina FasoBurundiCabo VerdeCambodiaCameroonCanadaCaribbean small statesCentral Europe and the BalticsChadChileChinaColombiaComorosCongo, Dem. Rep.Congo, Rep.Costa RicaCote d'IvoireCroatiaCubaCyprusCzech RepublicDenmarkDjiboutiDominican RepublicEarly-demographic dividendEast Asia & PacificEast Asia & Pacific (excluding high income)East Asia & Pacific (IDA & IBRD countries)EcuadorEgypt, Arab Rep.El SalvadorEquatorial GuineaEritreaEstoniaEthiopiaEuro areaEurope & Central AsiaEurope & Central Asia (excluding high income)Europe & Central Asia (IDA & IBRD countries)European UnionFijiFinlandFranceGabonGambia, TheGeorgiaGermanyGhanaGreeceGuatemalaGuineaGuinea-BissauHaitiHeavily indebted poor countries (HIPC)High incomeHondurasHong Kong SAR, ChinaHungaryIBRD onlyIcelandIDA & IBRD totalIDA blendIDA onlyIDA totalIndiaIndonesiaIran, Islamic Rep.IrelandIsraelItalyJamaicaJapanJordanKazakhstanKenyaKorea, Rep.KosovoKuwaitKyrgyz RepublicLao PDRLate-demographic dividendLatin America & Caribbean Latin America & Caribbean (excluding high income)Latin America & the Caribbean (IDA & IBRD countries)LatviaLeast developed countries: UN classificationLebanonLiberiaLibyaLithuaniaLow & middle incomeLow incomeLower middle incomeLuxembourgMacao SAR, ChinaMacedonia, FYRMadagascarMalawiMalaysiaMaliMaltaMauritaniaMauritiusMexicoMiddle East & North AfricaMiddle East & North Africa (excluding high income)Middle East & North Africa (IDA & IBRD countries)Middle incomeMoldovaMongoliaMontenegroMoroccoMozambiqueMyanmarNamibiaNepalNetherlandsNew ZealandNicaraguaNigerNigeriaNorth AmericaNorwayOECD membersOmanOther small statesPakistanPanamaPapua New GuineaParaguayPeruPhilippinesPolandPortugalPost-demographic dividendPre-demographic dividendPuerto RicoQatarRomaniaRussian FederationRwandaSamoaSaudi ArabiaSenegalSerbiaSeychellesSierra LeoneSingaporeSlovak RepublicSloveniaSmall statesSomaliaSouth AfricaSouth AsiaSouth Asia (IDA & IBRD)South SudanSpainSri LankaSub-Saharan Africa Sub-Saharan Africa (excluding high income)Sub-Saharan Africa (IDA & IBRD countries)SudanSurinameSwazilandSwedenSwitzerlandSyrian Arab RepublicTajikistanTanzaniaThailandTimor-LesteTogoTrinidad and TobagoTunisiaTurkeyTurkmenistanUgandaUkraineUnited Arab EmiratesUnited KingdomUnited StatesUpper middle incomeUruguayUzbekistanVanuatuVenezuela, RBVietnamWest Bank and GazaWorldZambiaZimbabwe Timeline:
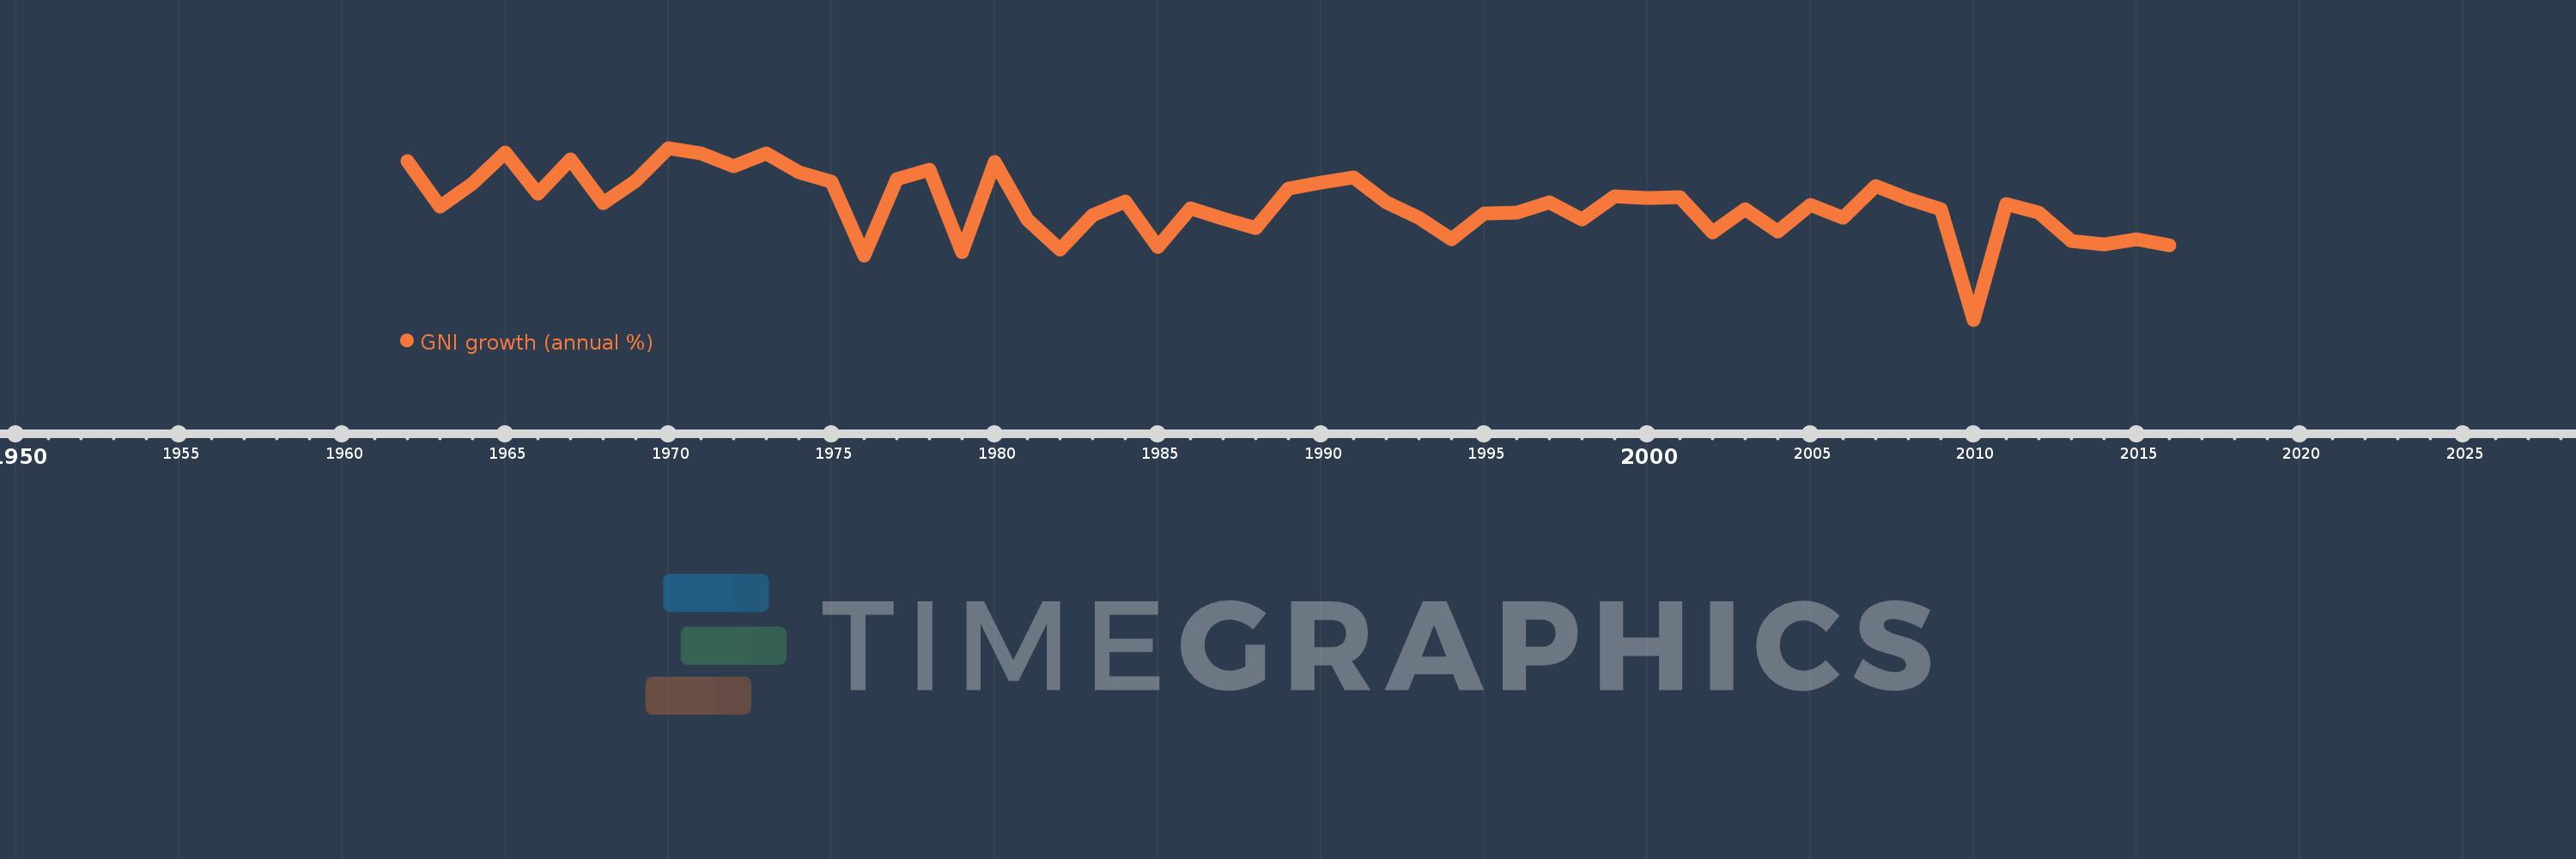
This timeline shows a graph from 1962 to 2016 of Austria. No data until 1961. Number of actual observations by date: 55.
Source name:
World Development Indicators
Source organization:
World Bank national accounts data, and OECD National Accounts data files.
Categories, topics:
Economy & Growth
Last updated:
apr 23, 2017
Indicators value changes by year
Minimum:
-4.519
jan 1, 2010
At the date of observation
Value
Absolute change
Change from previous value
jan 1, 1962
5.533
+5.533
0.0%
jan 1, 1963
2.649
-2.885
-52.14%
jan 1, 1964
4.139
+1.49
56.27%
jan 1, 1965
6.125
+1.986
47.99%
jan 1, 1966
3.48
-2.645
-43.19%
jan 1, 1967
5.66
+2.18
62.64%
jan 1, 1968
2.898
-2.761
-48.79%
jan 1, 1969
4.306
+1.408
48.57%
jan 1, 1970
6.389
+2.083
48.36%
jan 1, 1971
6.052
-0.337
-5.27%
jan 1, 1972
5.208
-0.844
-13.94%
jan 1, 1973
6.053
+0.845
16.22%
jan 1, 1974
4.843
-1.21
-19.99%
jan 1, 1975
4.242
-0.601
-12.4%
jan 1, 1976
-0.442
-4.684
-110.43%
jan 1, 1977
4.412
+4.855
-1.1K%
jan 1, 1978
5.012
+0.6
13.59%
jan 1, 1979
-0.214
-5.226
-104.28%
jan 1, 1980
5.482
+5.696
-2.66K%
jan 1, 1981
1.858
-3.624
-66.11%
jan 1, 1982
-0.087
-1.945
-104.68%
jan 1, 1983
2.136
+2.223
-2.56K%
jan 1, 1984
3.011
+0.875
40.98%
jan 1, 1985
0.082
-2.929
-97.28%
jan 1, 1986
2.576
+2.493
3.04K%
jan 1, 1987
1.903
-0.673
-26.13%
jan 1, 1988
1.323
-0.58
-30.46%
jan 1, 1989
3.806
+2.483
187.7%
jan 1, 1990
4.204
+0.398
10.46%
jan 1, 1991
4.5
+0.296
7.04%
jan 1, 1992
2.944
-1.556
-34.59%
jan 1, 1993
1.952
-0.991
-33.67%
jan 1, 1994
0.593
-1.36
-69.63%
jan 1, 1995
2.208
+1.615
272.36%
jan 1, 1996
2.29
+0.082
3.71%
jan 1, 1997
2.919
+0.629
27.49%
jan 1, 1998
1.847
-1.072
-36.73%
jan 1, 1999
3.34
+1.493
80.85%
jan 1, 2000
3.226
-0.114
-3.42%
jan 1, 2001
3.259
+0.033
1.02%
jan 1, 2002
1.033
-2.226
-68.3%
jan 1, 2003
2.526
+1.493
144.55%
jan 1, 2004
1.057
-1.469
-58.15%
jan 1, 2005
2.75
+1.693
160.12%
jan 1, 2006
1.971
-0.779
-28.34%
jan 1, 2007
3.965
+1.994
101.18%
jan 1, 2008
3.134
-0.83
-20.95%
jan 1, 2009
2.49
-0.644
-20.54%
jan 1, 2010
-4.519
-7.01
-281.48%
jan 1, 2011
2.811
+7.331
-162.2%
jan 1, 2012
2.294
-0.517
-18.39%
jan 1, 2013
0.509
-1.785
-77.8%
jan 1, 2014
0.278
-0.232
-45.5%
jan 1, 2015
0.593
+0.316
113.79%
jan 1, 2016
0.211
-0.382
-64.44%
Ranking of countries by current statistics by years


Comments: