29
/
en
AIzaSyAYiBZKx7MnpbEhh9jyipgxe19OcubqV5w
April 1, 2024
69833
Argentina
ARG
true
2
1
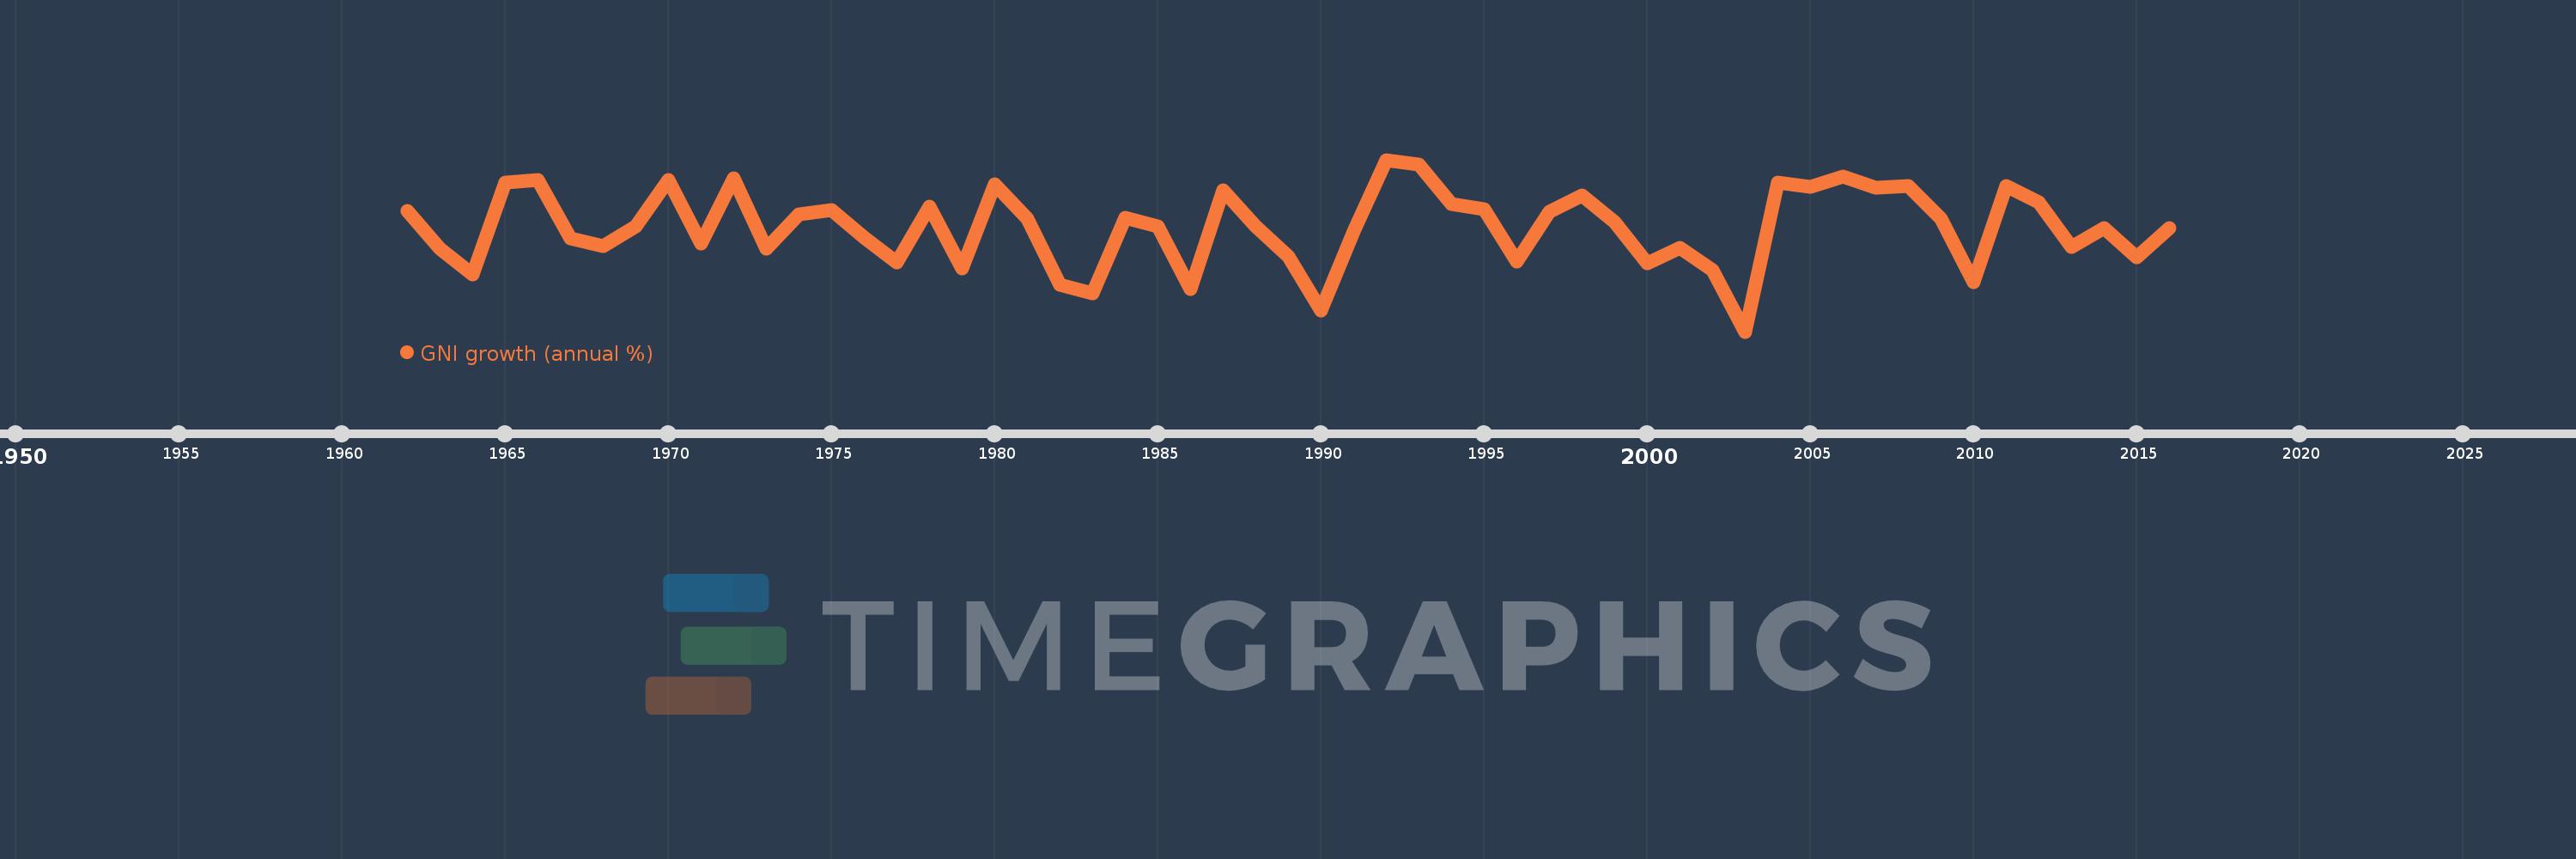
GNI growth (annual %)
2016,2015,2014,2013,2012,2011,2010,2009,2008,2007,2006,2005,2004,2003,2002,2001,2000,1999,1998,1997,1996,1995,1994,1993,1992,1991,1990,1989,1988,1987,1986,1985,1984,1983,1982,1981,1980,1979,1978,1977,1976,1975,1974,1973,1972,1971,1970,1969,1968,1967,1966,1965,1964,1963,1962
This statistics in other country:
AlbaniaAlgeriaAngolaAntigua and BarbudaArab WorldArgentinaArmeniaAustraliaAustriaAzerbaijanBahamas, TheBahrainBangladeshBarbadosBelarusBelgiumBelizeBeninBhutanBoliviaBosnia and HerzegovinaBotswanaBrazilBrunei DarussalamBulgariaBurkina FasoBurundiCabo VerdeCambodiaCameroonCanadaCaribbean small statesCentral Europe and the BalticsChadChileChinaColombiaComorosCongo, Dem. Rep.Congo, Rep.Costa RicaCote d'IvoireCroatiaCubaCyprusCzech RepublicDenmarkDjiboutiDominican RepublicEarly-demographic dividendEast Asia & PacificEast Asia & Pacific (excluding high income)East Asia & Pacific (IDA & IBRD countries)EcuadorEgypt, Arab Rep.El SalvadorEquatorial GuineaEritreaEstoniaEthiopiaEuro areaEurope & Central AsiaEurope & Central Asia (excluding high income)Europe & Central Asia (IDA & IBRD countries)European UnionFijiFinlandFranceGabonGambia, TheGeorgiaGermanyGhanaGreeceGuatemalaGuineaGuinea-BissauHaitiHeavily indebted poor countries (HIPC)High incomeHondurasHong Kong SAR, ChinaHungaryIBRD onlyIcelandIDA & IBRD totalIDA blendIDA onlyIDA totalIndiaIndonesiaIran, Islamic Rep.IrelandIsraelItalyJamaicaJapanJordanKazakhstanKenyaKorea, Rep.KosovoKuwaitKyrgyz RepublicLao PDRLate-demographic dividendLatin America & Caribbean Latin America & Caribbean (excluding high income)Latin America & the Caribbean (IDA & IBRD countries)LatviaLeast developed countries: UN classificationLebanonLiberiaLibyaLithuaniaLow & middle incomeLow incomeLower middle incomeLuxembourgMacao SAR, ChinaMacedonia, FYRMadagascarMalawiMalaysiaMaliMaltaMauritaniaMauritiusMexicoMiddle East & North AfricaMiddle East & North Africa (excluding high income)Middle East & North Africa (IDA & IBRD countries)Middle incomeMoldovaMongoliaMontenegroMoroccoMozambiqueMyanmarNamibiaNepalNetherlandsNew ZealandNicaraguaNigerNigeriaNorth AmericaNorwayOECD membersOmanOther small statesPakistanPanamaPapua New GuineaParaguayPeruPhilippinesPolandPortugalPost-demographic dividendPre-demographic dividendPuerto RicoQatarRomaniaRussian FederationRwandaSamoaSaudi ArabiaSenegalSerbiaSeychellesSierra LeoneSingaporeSlovak RepublicSloveniaSmall statesSomaliaSouth AfricaSouth AsiaSouth Asia (IDA & IBRD)South SudanSpainSri LankaSub-Saharan Africa Sub-Saharan Africa (excluding high income)Sub-Saharan Africa (IDA & IBRD countries)SudanSurinameSwazilandSwedenSwitzerlandSyrian Arab RepublicTajikistanTanzaniaThailandTimor-LesteTogoTrinidad and TobagoTunisiaTurkeyTurkmenistanUgandaUkraineUnited Arab EmiratesUnited KingdomUnited StatesUpper middle incomeUruguayUzbekistanVanuatuVenezuela, RBVietnamWest Bank and GazaWorldZambiaZimbabwe Timeline:
This timeline shows a graph from 1962 to 2016 of Argentina. No data until 1961. Number of actual observations by date: 55.
Source name:
World Development Indicators
Source organization:
World Bank national accounts data, and OECD National Accounts data files.
Categories, topics:
Economy & Growth
Last updated:
apr 23, 2017
Indicators value changes by year
Minimum:
-14.971
jan 1, 2003
Maximum:
14.047
jan 1, 1992
At the date of observation
Value
Absolute change
Change from previous value
jan 1, 1962
5.477
+5.477
0.0%
jan 1, 1963
-1.023
-6.5
-118.67%
jan 1, 1964
-5.25
-4.227
413.28%
jan 1, 1965
10.185
+15.436
-294.0%
jan 1, 1966
10.611
+0.425
4.17%
jan 1, 1967
0.732
-9.879
-93.1%
jan 1, 1968
-0.507
-1.239
-169.29%
jan 1, 1969
2.871
+3.378
-666.13%
jan 1, 1970
10.566
+7.695
268.02%
jan 1, 1971
-0.115
-10.681
-101.09%
jan 1, 1972
10.898
+11.013
-9.59K%
jan 1, 1973
-0.948
-11.846
-108.7%
jan 1, 1974
4.776
+5.724
-603.68%
jan 1, 1975
5.527
+0.75
15.71%
jan 1, 1976
0.983
-4.543
-82.21%
jan 1, 1977
-3.295
-4.278
-435.08%
jan 1, 1978
6.079
+9.373
-284.5%
jan 1, 1979
-4.361
-10.44
-171.75%
jan 1, 1980
9.915
+14.276
-327.34%
jan 1, 1981
4.156
-5.759
-58.09%
jan 1, 1982
-7.092
-11.247
-270.66%
jan 1, 1983
-8.446
-1.354
19.09%
jan 1, 1984
4.221
+12.667
-149.98%
jan 1, 1985
2.744
-1.478
-35.01%
jan 1, 1986
-7.757
-10.501
-382.73%
jan 1, 1987
8.885
+16.642
-214.54%
jan 1, 1988
2.79
-6.095
-68.59%
jan 1, 1989
-2.279
-5.069
-181.66%
jan 1, 1990
-11.366
-9.087
398.77%
jan 1, 1991
1.969
+13.335
-117.33%
jan 1, 1992
14.047
+12.078
613.32%
jan 1, 1993
13.252
-0.795
-5.66%
jan 1, 1994
6.509
-6.742
-50.88%
jan 1, 1995
5.68
-0.829
-12.74%
jan 1, 1996
-3.182
-8.862
-156.03%
jan 1, 1997
5.273
+8.455
-265.68%
jan 1, 1998
7.977
+2.704
51.28%
jan 1, 1999
3.482
-4.495
-56.35%
jan 1, 2000
-3.504
-6.986
-200.63%
jan 1, 2001
-0.827
+2.677
-76.41%
jan 1, 2002
-4.58
-3.753
453.98%
jan 1, 2003
-14.971
-10.391
226.9%
jan 1, 2004
10.149
+25.12
-167.79%
jan 1, 2005
9.54
-0.609
-6.0%
jan 1, 2006
11.181
+1.641
17.2%
jan 1, 2007
9.3
-1.881
-16.83%
jan 1, 2008
9.667
+0.367
3.95%
jan 1, 2009
4.047
-5.62
-58.14%
jan 1, 2010
-6.588
-10.635
-262.8%
jan 1, 2011
9.669
+16.257
-246.77%
jan 1, 2012
6.815
-2.854
-29.52%
jan 1, 2013
-0.615
-7.431
-109.03%
jan 1, 2014
2.54
+3.156
-512.84%
jan 1, 2015
-2.434
-4.974
-195.8%
jan 1, 2016
2.518
+4.952
-203.48%
Ranking of countries by current statistics by years


Comments: