29
/
en
AIzaSyAYiBZKx7MnpbEhh9jyipgxe19OcubqV5w
April 1, 2024
256357
Sweden
SWE
true
2
1
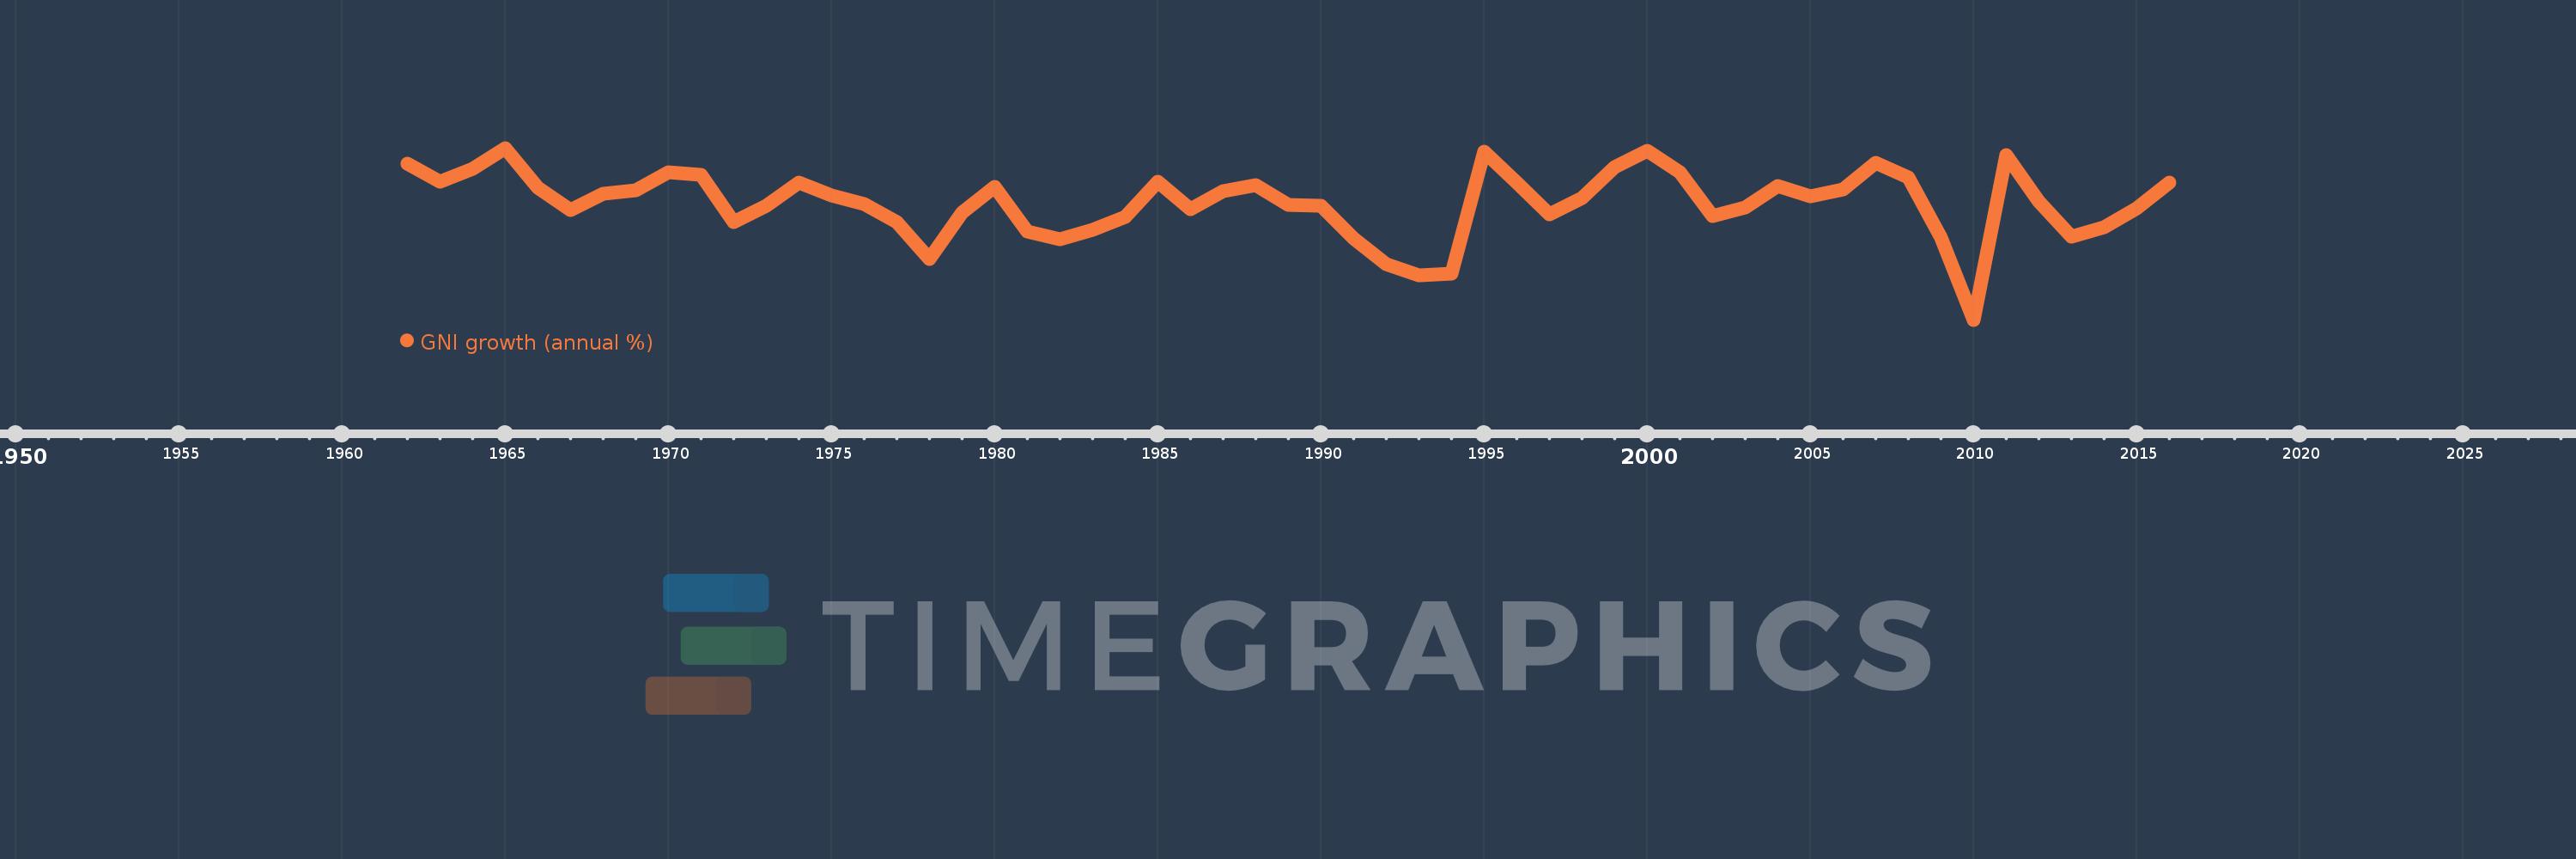
GNI growth (annual %)
2016,2015,2014,2013,2012,2011,2010,2009,2008,2007,2006,2005,2004,2003,2002,2001,2000,1999,1998,1997,1996,1995,1994,1993,1992,1991,1990,1989,1988,1987,1986,1985,1984,1983,1982,1981,1980,1979,1978,1977,1976,1975,1974,1973,1972,1971,1970,1969,1968,1967,1966,1965,1964,1963,1962
This statistics in other country:
AlbaniaAlgeriaAngolaAntigua and BarbudaArab WorldArgentinaArmeniaAustraliaAustriaAzerbaijanBahamas, TheBahrainBangladeshBarbadosBelarusBelgiumBelizeBeninBhutanBoliviaBosnia and HerzegovinaBotswanaBrazilBrunei DarussalamBulgariaBurkina FasoBurundiCabo VerdeCambodiaCameroonCanadaCaribbean small statesCentral Europe and the BalticsChadChileChinaColombiaComorosCongo, Dem. Rep.Congo, Rep.Costa RicaCote d'IvoireCroatiaCubaCyprusCzech RepublicDenmarkDjiboutiDominican RepublicEarly-demographic dividendEast Asia & PacificEast Asia & Pacific (excluding high income)East Asia & Pacific (IDA & IBRD countries)EcuadorEgypt, Arab Rep.El SalvadorEquatorial GuineaEritreaEstoniaEthiopiaEuro areaEurope & Central AsiaEurope & Central Asia (excluding high income)Europe & Central Asia (IDA & IBRD countries)European UnionFijiFinlandFranceGabonGambia, TheGeorgiaGermanyGhanaGreeceGuatemalaGuineaGuinea-BissauHaitiHeavily indebted poor countries (HIPC)High incomeHondurasHong Kong SAR, ChinaHungaryIBRD onlyIcelandIDA & IBRD totalIDA blendIDA onlyIDA totalIndiaIndonesiaIran, Islamic Rep.IrelandIsraelItalyJamaicaJapanJordanKazakhstanKenyaKorea, Rep.KosovoKuwaitKyrgyz RepublicLao PDRLate-demographic dividendLatin America & Caribbean Latin America & Caribbean (excluding high income)Latin America & the Caribbean (IDA & IBRD countries)LatviaLeast developed countries: UN classificationLebanonLiberiaLibyaLithuaniaLow & middle incomeLow incomeLower middle incomeLuxembourgMacao SAR, ChinaMacedonia, FYRMadagascarMalawiMalaysiaMaliMaltaMauritaniaMauritiusMexicoMiddle East & North AfricaMiddle East & North Africa (excluding high income)Middle East & North Africa (IDA & IBRD countries)Middle incomeMoldovaMongoliaMontenegroMoroccoMozambiqueMyanmarNamibiaNepalNetherlandsNew ZealandNicaraguaNigerNigeriaNorth AmericaNorwayOECD membersOmanOther small statesPakistanPanamaPapua New GuineaParaguayPeruPhilippinesPolandPortugalPost-demographic dividendPre-demographic dividendPuerto RicoQatarRomaniaRussian FederationRwandaSamoaSaudi ArabiaSenegalSerbiaSeychellesSierra LeoneSingaporeSlovak RepublicSloveniaSmall statesSomaliaSouth AfricaSouth AsiaSouth Asia (IDA & IBRD)South SudanSpainSri LankaSub-Saharan Africa Sub-Saharan Africa (excluding high income)Sub-Saharan Africa (IDA & IBRD countries)SudanSurinameSwazilandSwedenSwitzerlandSyrian Arab RepublicTajikistanTanzaniaThailandTimor-LesteTogoTrinidad and TobagoTunisiaTurkeyTurkmenistanUgandaUkraineUnited Arab EmiratesUnited KingdomUnited StatesUpper middle incomeUruguayUzbekistanVanuatuVenezuela, RBVietnamWest Bank and GazaWorldZambiaZimbabwe Timeline:
This timeline shows a graph from 1962 to 2016 of Sweden. No data until 1961. Number of actual observations by date: 55.
Source name:
World Development Indicators
Source organization:
World Bank national accounts data, and OECD National Accounts data files.
Categories, topics:
Economy & Growth
Last updated:
apr 23, 2017
Indicators value changes by year
Minimum:
-6.537
jan 1, 2010
At the date of observation
Value
Absolute change
Change from previous value
jan 1, 1962
5.644
+5.644
0.0%
jan 1, 1963
4.275
-1.369
-24.26%
jan 1, 1964
5.291
+1.016
23.76%
jan 1, 1965
6.9
+1.609
30.41%
jan 1, 1966
3.775
-3.125
-45.29%
jan 1, 1967
2.058
-1.717
-45.48%
jan 1, 1968
3.311
+1.252
60.86%
jan 1, 1969
3.6
+0.29
8.76%
jan 1, 1970
4.978
+1.377
38.25%
jan 1, 1971
4.773
-0.205
-4.11%
jan 1, 1972
1.092
-3.681
-77.13%
jan 1, 1973
2.377
+1.285
117.7%
jan 1, 1974
4.172
+1.796
75.55%
jan 1, 1975
3.18
-0.992
-23.78%
jan 1, 1976
2.541
-0.639
-20.1%
jan 1, 1977
1.07
-1.471
-57.9%
jan 1, 1978
-1.785
-2.854
-266.82%
jan 1, 1979
1.86
+3.645
-204.23%
jan 1, 1980
3.872
+2.012
108.15%
jan 1, 1981
0.363
-3.509
-90.63%
jan 1, 1982
-0.212
-0.575
-158.33%
jan 1, 1983
0.496
+0.707
-334.18%
jan 1, 1984
1.472
+0.977
197.01%
jan 1, 1985
4.275
+2.802
190.31%
jan 1, 1986
2.134
-2.14
-50.07%
jan 1, 1987
3.523
+1.389
65.08%
jan 1, 1988
4.023
+0.5
14.19%
jan 1, 1989
2.443
-1.58
-39.28%
jan 1, 1990
2.369
-0.074
-3.02%
jan 1, 1991
-0.156
-2.525
-106.57%
jan 1, 1992
-2.177
-2.022
1.3K%
jan 1, 1993
-3.082
-0.905
41.55%
jan 1, 1994
-2.902
+0.181
-5.86%
jan 1, 1995
6.629
+9.531
-328.45%
jan 1, 1996
4.175
-2.454
-37.03%
jan 1, 1997
1.727
-2.447
-58.62%
jan 1, 1998
2.99
+1.263
73.11%
jan 1, 1999
5.409
+2.419
80.88%
jan 1, 2000
6.708
+1.299
24.02%
jan 1, 2001
4.982
-1.726
-25.73%
jan 1, 2002
1.584
-3.398
-68.21%
jan 1, 2003
2.264
+0.68
42.96%
jan 1, 2004
3.892
+1.628
71.91%
jan 1, 2005
3.148
-0.744
-19.11%
jan 1, 2006
3.632
+0.484
15.37%
jan 1, 2007
5.734
+2.102
57.88%
jan 1, 2008
4.616
-1.118
-19.49%
jan 1, 2009
-0.076
-4.693
-101.66%
jan 1, 2010
-6.537
-6.461
8.45K%
jan 1, 2011
6.357
+12.894
-197.24%
jan 1, 2012
2.708
-3.649
-57.4%
jan 1, 2013
-0.03
-2.738
-101.09%
jan 1, 2014
0.697
+0.726
-2.46K%
jan 1, 2015
2.147
+1.45
208.14%
jan 1, 2016
4.188
+2.04
95.02%
Ranking of countries by current statistics by years


Comments: