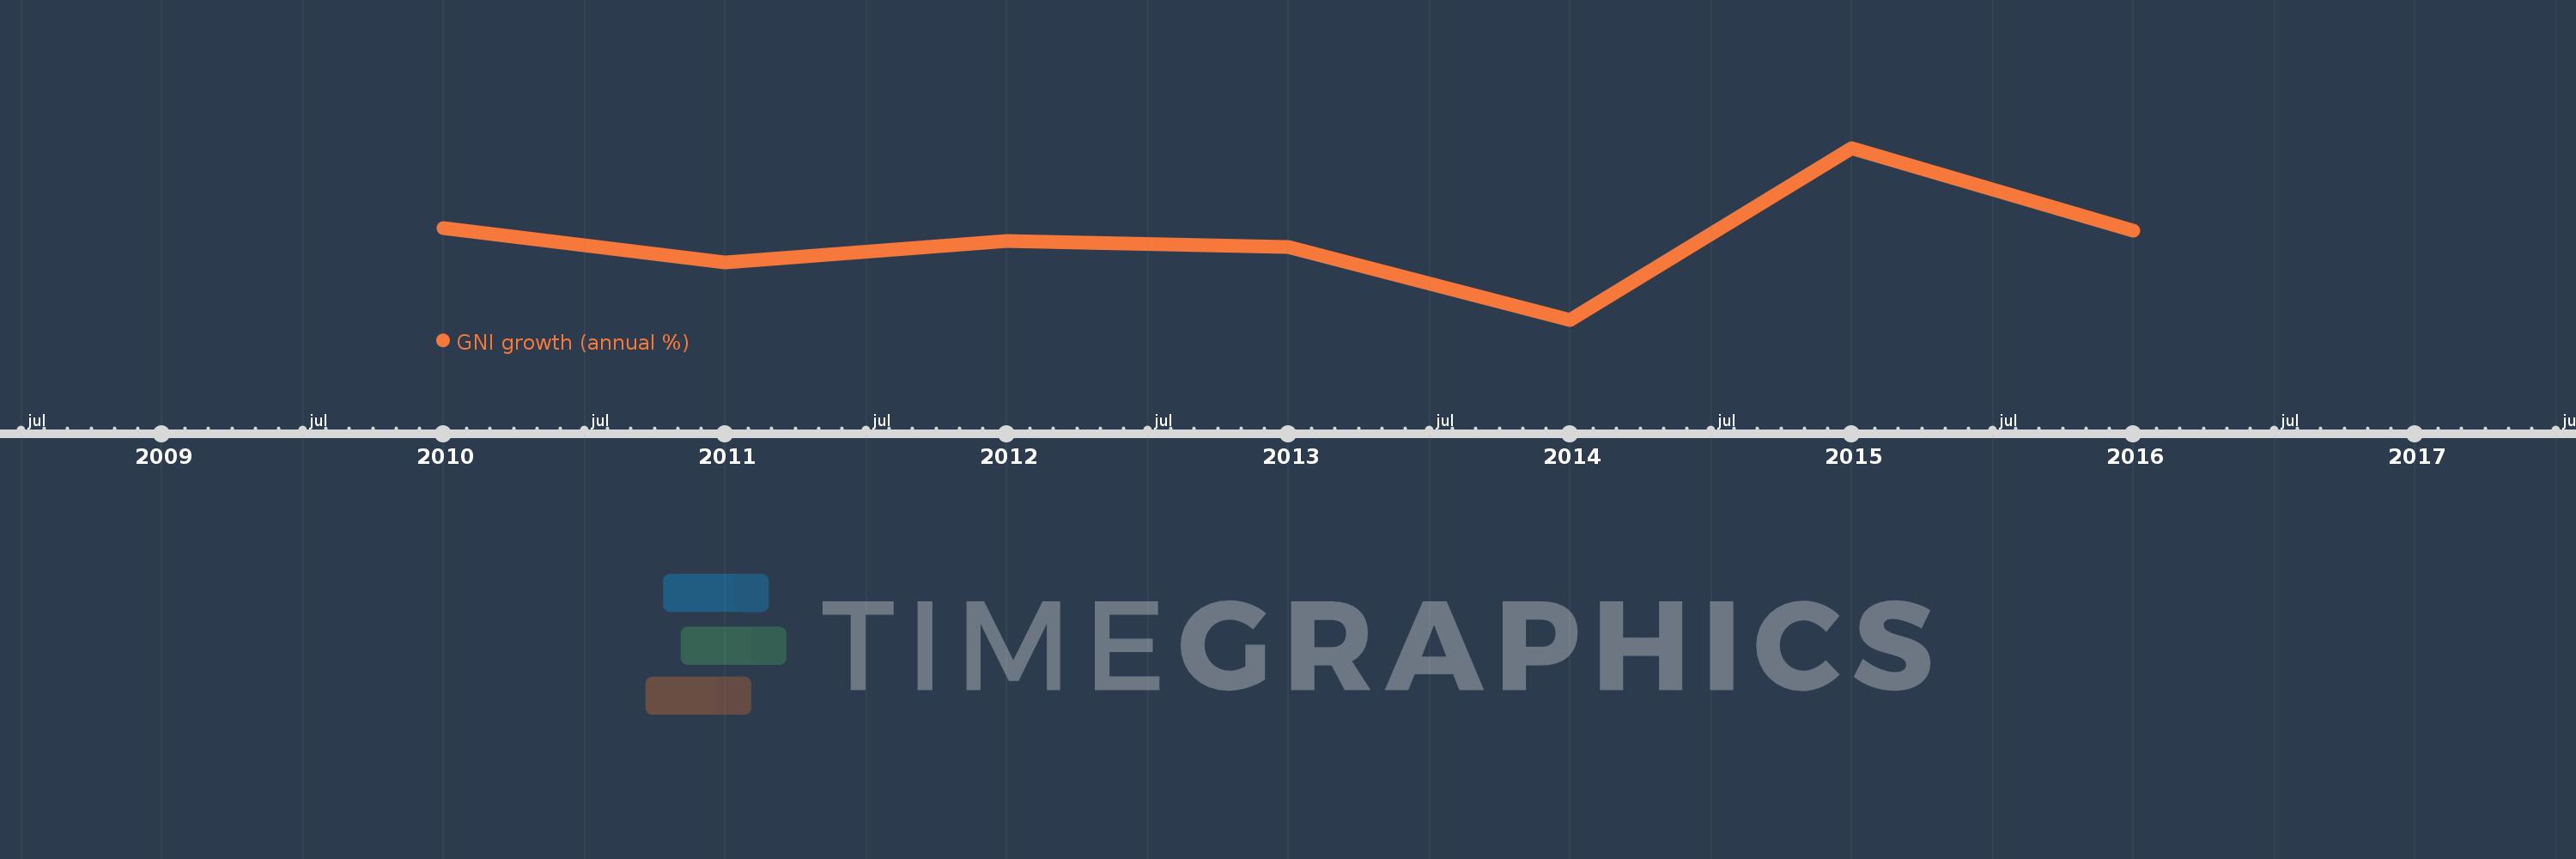
This timeline shows a graph from 2010 to 2016 of Least developed countries: UN classification. No data until 2009. Number of actual observations by date: 7.
Source name:
World Development Indicators
Source organization:
World Bank national accounts data, and OECD National Accounts data files.
Categories, topics:
Economy & Growth
Last updated:
apr 23, 2017
Indicators value changes by year
Meaning:
4.826
Minimum:
1.815
jan 1, 2014
Maximum:
8.266
jan 1, 2015
At the date of observation
Value
Absolute change
Change from the previous value
jan 1, 2010
5.249
+5.249
0.0%
jan 1, 2011
3.982
-1.267
-24.14%
jan 1, 2012
4.771
+0.789
19.8%
jan 1, 2013
4.55
-0.221
-4.64%
jan 1, 2014
1.815
-2.735
-60.11%
jan 1, 2015
8.266
+6.451
355.45%
jan 1, 2016
5.148
-3.117
-37.71%
Ranking of countries by current statistics by years
