29
/
en
AIzaSyAYiBZKx7MnpbEhh9jyipgxe19OcubqV5w
April 1, 2024
26527
Early-demographic dividend
EAR
false
2
1
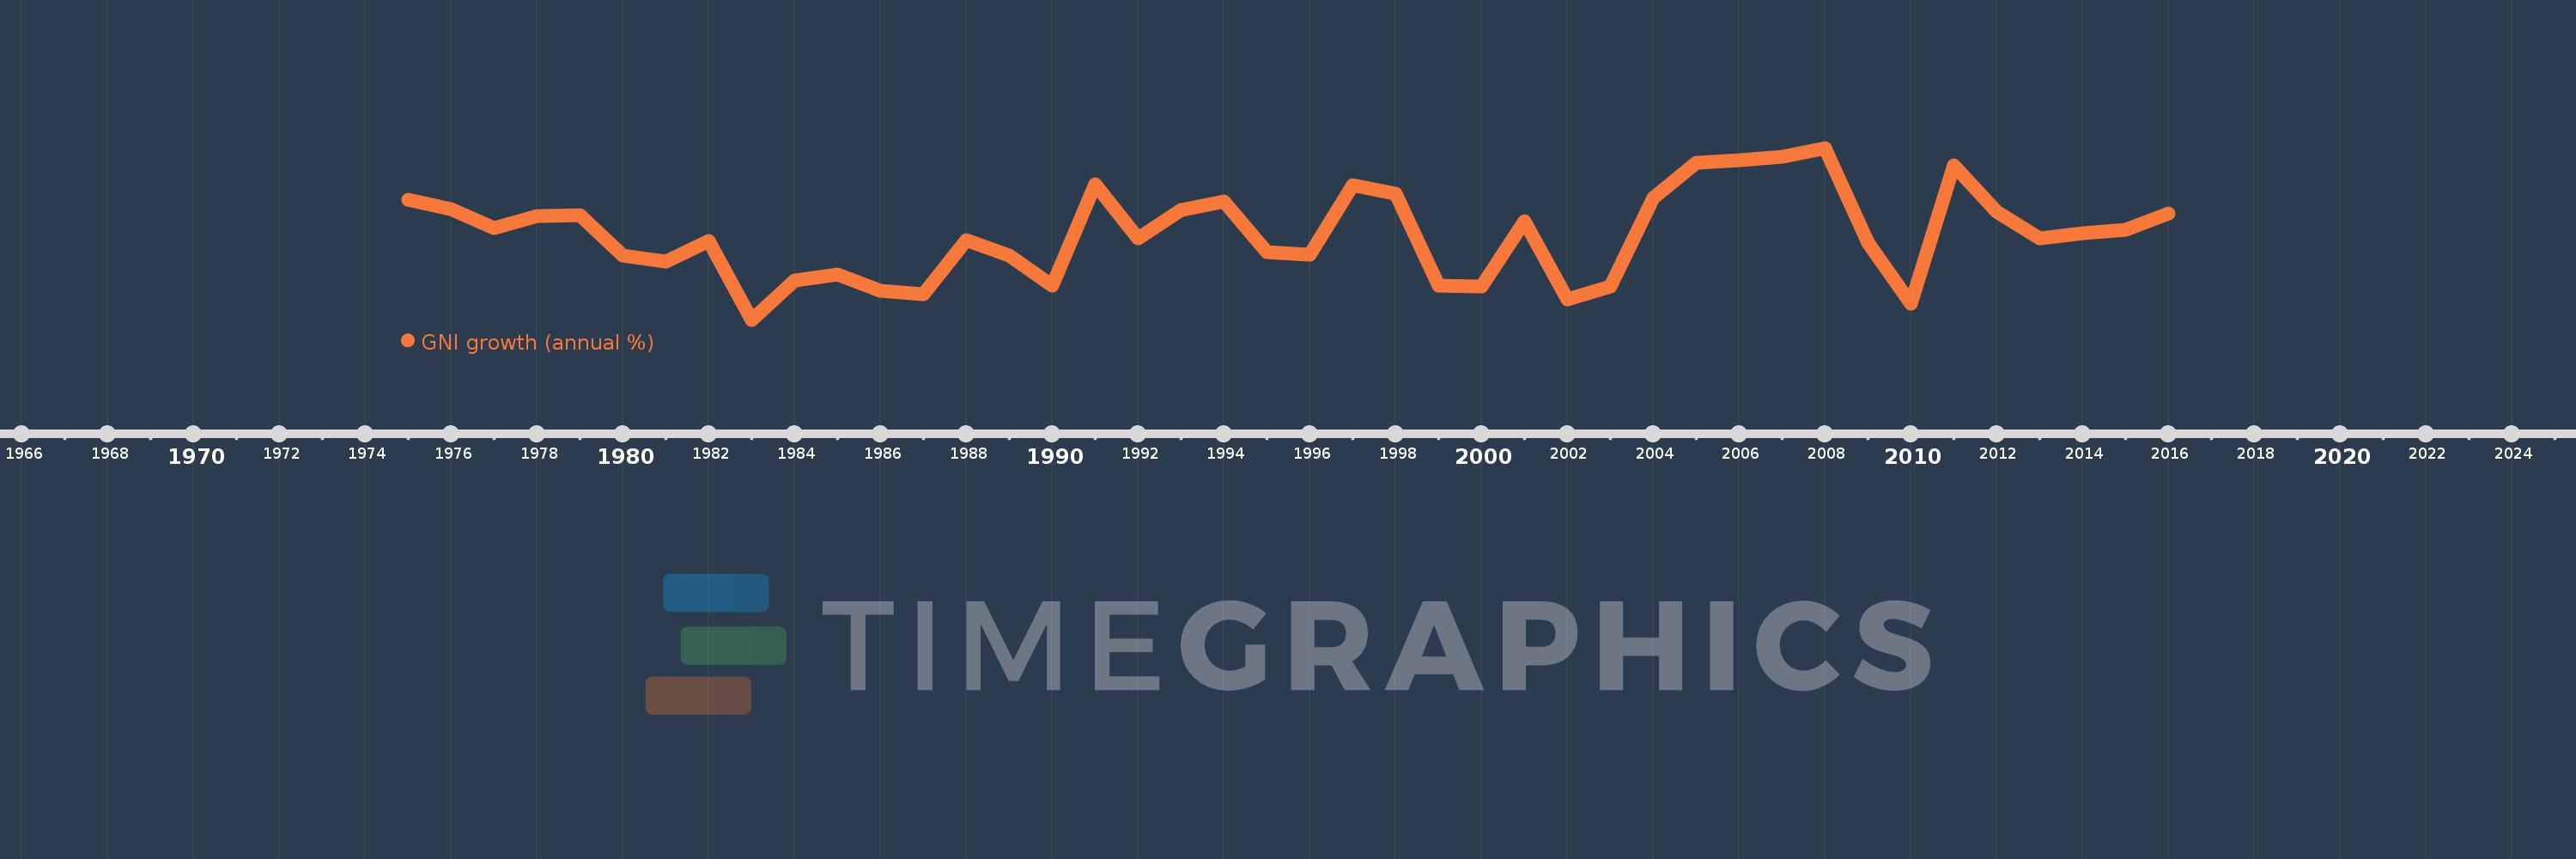
GNI growth (annual %)
2016,2015,2014,2013,2012,2011,2010,2009,2008,2007,2006,2005,2004,2003,2002,2001,2000,1999,1998,1997,1996,1995,1994,1993,1992,1991,1990,1989,1988,1987,1986,1985,1984,1983,1982,1981,1980,1979,1978,1977,1976,1975
This statistics in other country:
AlbaniaAlgeriaAngolaAntigua and BarbudaArab WorldArgentinaArmeniaAustraliaAustriaAzerbaijanBahamas, TheBahrainBangladeshBarbadosBelarusBelgiumBelizeBeninBhutanBoliviaBosnia and HerzegovinaBotswanaBrazilBrunei DarussalamBulgariaBurkina FasoBurundiCabo VerdeCambodiaCameroonCanadaCaribbean small statesCentral Europe and the BalticsChadChileChinaColombiaComorosCongo, Dem. Rep.Congo, Rep.Costa RicaCote d'IvoireCroatiaCubaCyprusCzech RepublicDenmarkDjiboutiDominican RepublicEarly-demographic dividendEast Asia & PacificEast Asia & Pacific (excluding high income)East Asia & Pacific (IDA & IBRD countries)EcuadorEgypt, Arab Rep.El SalvadorEquatorial GuineaEritreaEstoniaEthiopiaEuro areaEurope & Central AsiaEurope & Central Asia (excluding high income)Europe & Central Asia (IDA & IBRD countries)European UnionFijiFinlandFranceGabonGambia, TheGeorgiaGermanyGhanaGreeceGuatemalaGuineaGuinea-BissauHaitiHeavily indebted poor countries (HIPC)High incomeHondurasHong Kong SAR, ChinaHungaryIBRD onlyIcelandIDA & IBRD totalIDA blendIDA onlyIDA totalIndiaIndonesiaIran, Islamic Rep.IrelandIsraelItalyJamaicaJapanJordanKazakhstanKenyaKorea, Rep.KosovoKuwaitKyrgyz RepublicLao PDRLate-demographic dividendLatin America & Caribbean Latin America & Caribbean (excluding high income)Latin America & the Caribbean (IDA & IBRD countries)LatviaLeast developed countries: UN classificationLebanonLiberiaLibyaLithuaniaLow & middle incomeLow incomeLower middle incomeLuxembourgMacao SAR, ChinaMacedonia, FYRMadagascarMalawiMalaysiaMaliMaltaMauritaniaMauritiusMexicoMiddle East & North AfricaMiddle East & North Africa (excluding high income)Middle East & North Africa (IDA & IBRD countries)Middle incomeMoldovaMongoliaMontenegroMoroccoMozambiqueMyanmarNamibiaNepalNetherlandsNew ZealandNicaraguaNigerNigeriaNorth AmericaNorwayOECD membersOmanOther small statesPakistanPanamaPapua New GuineaParaguayPeruPhilippinesPolandPortugalPost-demographic dividendPre-demographic dividendPuerto RicoQatarRomaniaRussian FederationRwandaSamoaSaudi ArabiaSenegalSerbiaSeychellesSierra LeoneSingaporeSlovak RepublicSloveniaSmall statesSomaliaSouth AfricaSouth AsiaSouth Asia (IDA & IBRD)South SudanSpainSri LankaSub-Saharan Africa Sub-Saharan Africa (excluding high income)Sub-Saharan Africa (IDA & IBRD countries)SudanSurinameSwazilandSwedenSwitzerlandSyrian Arab RepublicTajikistanTanzaniaThailandTimor-LesteTogoTrinidad and TobagoTunisiaTurkeyTurkmenistanUgandaUkraineUnited Arab EmiratesUnited KingdomUnited StatesUpper middle incomeUruguayUzbekistanVanuatuVenezuela, RBVietnamWest Bank and GazaWorldZambiaZimbabwe Timeline:
This timeline shows a graph from 1975 to 2016 of Early-demographic dividend. No data until 1974. Number of actual observations by date: 42.
Source name:
World Development Indicators
Source organization:
World Bank national accounts data, and OECD National Accounts data files.
Categories, topics:
Economy & Growth
Last updated:
apr 23, 2017
Indicators value changes by year
At the date of observation
Value
Absolute change
Change from previous value
jan 1, 1975
5.153
+5.153
0.0%
jan 1, 1976
4.794
-0.359
-6.97%
jan 1, 1977
4.023
-0.771
-16.07%
jan 1, 1978
4.528
+0.505
12.54%
jan 1, 1979
4.559
+0.031
0.68%
jan 1, 1980
2.952
-1.607
-35.24%
jan 1, 1981
2.701
-0.251
-8.52%
jan 1, 1982
3.511
+0.81
30.0%
jan 1, 1983
0.375
-3.137
-89.33%
jan 1, 1984
1.94
+1.565
417.92%
jan 1, 1985
2.172
+0.232
11.97%
jan 1, 1986
1.528
-0.644
-29.63%
jan 1, 1987
1.394
-0.135
-8.82%
jan 1, 1988
3.561
+2.168
155.53%
jan 1, 1989
2.946
-0.615
-17.27%
jan 1, 1990
1.753
-1.193
-40.5%
jan 1, 1991
5.798
+4.045
230.72%
jan 1, 1992
3.624
-2.173
-37.48%
jan 1, 1993
4.757
+1.132
31.24%
jan 1, 1994
5.085
+0.328
6.89%
jan 1, 1995
3.072
-2.013
-39.58%
jan 1, 1996
2.968
-0.104
-3.4%
jan 1, 1997
5.753
+2.785
93.86%
jan 1, 1998
5.392
-0.361
-6.27%
jan 1, 1999
1.741
-3.651
-67.72%
jan 1, 2000
1.691
-0.05
-2.85%
jan 1, 2001
4.323
+2.632
155.63%
jan 1, 2002
1.182
-3.141
-72.66%
jan 1, 2003
1.694
+0.512
43.35%
jan 1, 2004
5.226
+3.532
208.53%
jan 1, 2005
6.625
+1.399
26.77%
jan 1, 2006
6.732
+0.107
1.62%
jan 1, 2007
6.875
+0.143
2.12%
jan 1, 2008
7.234
+0.359
5.22%
jan 1, 2009
3.451
-3.783
-52.29%
jan 1, 2010
1.01
-2.441
-70.73%
jan 1, 2011
6.521
+5.511
545.44%
jan 1, 2012
4.671
-1.85
-28.37%
jan 1, 2013
3.629
-1.043
-22.32%
jan 1, 2014
3.816
+0.187
5.16%
jan 1, 2015
3.966
+0.15
3.93%
jan 1, 2016
4.602
+0.636
16.04%
Ranking of countries by current statistics by years


Comments: