29
/
en
AIzaSyAYiBZKx7MnpbEhh9jyipgxe19OcubqV5w
April 1, 2024
112269
Costa Rica
CRI
true
2
1
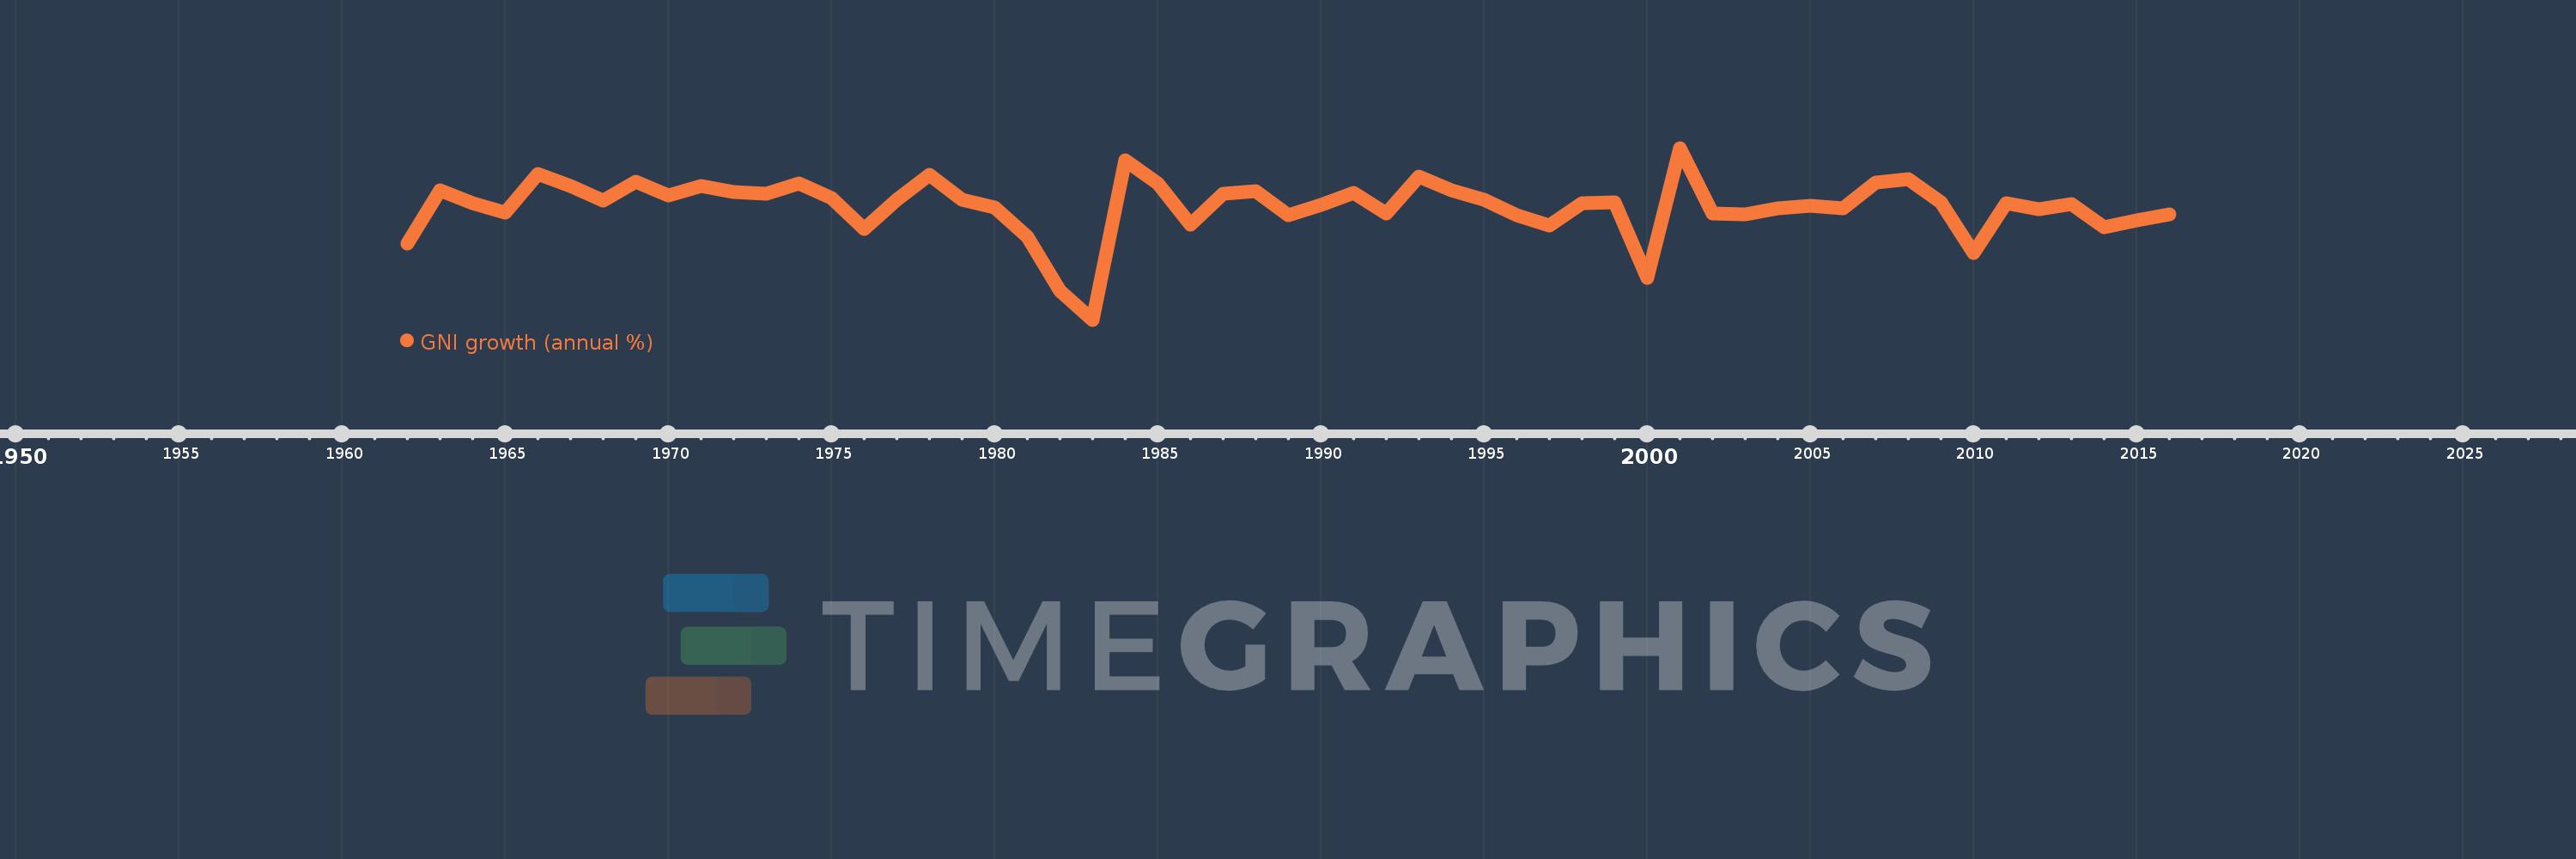
GNI growth (annual %)
2016,2015,2014,2013,2012,2011,2010,2009,2008,2007,2006,2005,2004,2003,2002,2001,2000,1999,1998,1997,1996,1995,1994,1993,1992,1991,1990,1989,1988,1987,1986,1985,1984,1983,1982,1981,1980,1979,1978,1977,1976,1975,1974,1973,1972,1971,1970,1969,1968,1967,1966,1965,1964,1963,1962
This statistics in other country:
AlbaniaAlgeriaAngolaAntigua and BarbudaArab WorldArgentinaArmeniaAustraliaAustriaAzerbaijanBahamas, TheBahrainBangladeshBarbadosBelarusBelgiumBelizeBeninBhutanBoliviaBosnia and HerzegovinaBotswanaBrazilBrunei DarussalamBulgariaBurkina FasoBurundiCabo VerdeCambodiaCameroonCanadaCaribbean small statesCentral Europe and the BalticsChadChileChinaColombiaComorosCongo, Dem. Rep.Congo, Rep.Costa RicaCote d'IvoireCroatiaCubaCyprusCzech RepublicDenmarkDjiboutiDominican RepublicEarly-demographic dividendEast Asia & PacificEast Asia & Pacific (excluding high income)East Asia & Pacific (IDA & IBRD countries)EcuadorEgypt, Arab Rep.El SalvadorEquatorial GuineaEritreaEstoniaEthiopiaEuro areaEurope & Central AsiaEurope & Central Asia (excluding high income)Europe & Central Asia (IDA & IBRD countries)European UnionFijiFinlandFranceGabonGambia, TheGeorgiaGermanyGhanaGreeceGuatemalaGuineaGuinea-BissauHaitiHeavily indebted poor countries (HIPC)High incomeHondurasHong Kong SAR, ChinaHungaryIBRD onlyIcelandIDA & IBRD totalIDA blendIDA onlyIDA totalIndiaIndonesiaIran, Islamic Rep.IrelandIsraelItalyJamaicaJapanJordanKazakhstanKenyaKorea, Rep.KosovoKuwaitKyrgyz RepublicLao PDRLate-demographic dividendLatin America & Caribbean Latin America & Caribbean (excluding high income)Latin America & the Caribbean (IDA & IBRD countries)LatviaLeast developed countries: UN classificationLebanonLiberiaLibyaLithuaniaLow & middle incomeLow incomeLower middle incomeLuxembourgMacao SAR, ChinaMacedonia, FYRMadagascarMalawiMalaysiaMaliMaltaMauritaniaMauritiusMexicoMiddle East & North AfricaMiddle East & North Africa (excluding high income)Middle East & North Africa (IDA & IBRD countries)Middle incomeMoldovaMongoliaMontenegroMoroccoMozambiqueMyanmarNamibiaNepalNetherlandsNew ZealandNicaraguaNigerNigeriaNorth AmericaNorwayOECD membersOmanOther small statesPakistanPanamaPapua New GuineaParaguayPeruPhilippinesPolandPortugalPost-demographic dividendPre-demographic dividendPuerto RicoQatarRomaniaRussian FederationRwandaSamoaSaudi ArabiaSenegalSerbiaSeychellesSierra LeoneSingaporeSlovak RepublicSloveniaSmall statesSomaliaSouth AfricaSouth AsiaSouth Asia (IDA & IBRD)South SudanSpainSri LankaSub-Saharan Africa Sub-Saharan Africa (excluding high income)Sub-Saharan Africa (IDA & IBRD countries)SudanSurinameSwazilandSwedenSwitzerlandSyrian Arab RepublicTajikistanTanzaniaThailandTimor-LesteTogoTrinidad and TobagoTunisiaTurkeyTurkmenistanUgandaUkraineUnited Arab EmiratesUnited KingdomUnited StatesUpper middle incomeUruguayUzbekistanVanuatuVenezuela, RBVietnamWest Bank and GazaWorldZambiaZimbabwe Timeline:
This timeline shows a graph from 1962 to 2016 of Costa Rica. No data until 1961. Number of actual observations by date: 55.
Source name:
World Development Indicators
Source organization:
World Bank national accounts data, and OECD National Accounts data files.
Categories, topics:
Economy & Growth
Last updated:
apr 23, 2017
Indicators value changes by year
Minimum:
-12.701
jan 1, 1983
Maximum:
13.554
jan 1, 2001
At the date of observation
Value
Absolute change
Change from previous value
jan 1, 1962
-1.112
-1.112
0.0%
jan 1, 1963
7.137
+8.248
-742.05%
jan 1, 1964
5.096
-2.041
-28.59%
jan 1, 1965
3.716
-1.38
-27.08%
jan 1, 1966
9.613
+5.897
158.68%
jan 1, 1967
7.801
-1.811
-18.84%
jan 1, 1968
5.533
-2.268
-29.07%
jan 1, 1969
8.419
+2.886
52.16%
jan 1, 1970
6.246
-2.174
-25.82%
jan 1, 1971
7.779
+1.533
24.55%
jan 1, 1972
6.861
-0.918
-11.8%
jan 1, 1973
6.611
-0.249
-3.64%
jan 1, 1974
8.102
+1.491
22.55%
jan 1, 1975
5.906
-2.196
-27.1%
jan 1, 1976
1.144
-4.762
-80.63%
jan 1, 1977
5.616
+4.472
390.9%
jan 1, 1978
9.402
+3.786
67.41%
jan 1, 1979
5.664
-3.738
-39.76%
jan 1, 1980
4.502
-1.162
-20.52%
jan 1, 1981
-0.013
-4.515
-100.3%
jan 1, 1982
-8.316
-8.303
62.51K%
jan 1, 1983
-12.701
-4.386
52.74%
jan 1, 1984
11.648
+24.349
-191.7%
jan 1, 1985
8.191
-3.456
-29.67%
jan 1, 1986
1.767
-6.424
-78.43%
jan 1, 1987
6.521
+4.754
269.03%
jan 1, 1988
6.995
+0.474
7.26%
jan 1, 1989
3.281
-3.714
-53.1%
jan 1, 1990
4.812
+1.531
46.66%
jan 1, 1991
6.674
+1.863
38.71%
jan 1, 1992
3.585
-3.09
-46.29%
jan 1, 1993
9.232
+5.647
157.53%
jan 1, 1994
7.101
-2.131
-23.09%
jan 1, 1995
5.676
-1.425
-20.07%
jan 1, 1996
3.334
-2.342
-41.26%
jan 1, 1997
1.648
-1.686
-50.58%
jan 1, 1998
5.104
+3.456
209.74%
jan 1, 1999
5.296
+0.192
3.76%
jan 1, 2000
-6.32
-11.616
-219.35%
jan 1, 2001
13.554
+19.875
-314.45%
jan 1, 2002
3.539
-10.015
-73.89%
jan 1, 2003
3.348
-0.191
-5.41%
jan 1, 2004
4.296
+0.948
28.31%
jan 1, 2005
4.708
+0.413
9.6%
jan 1, 2006
4.317
-0.391
-8.3%
jan 1, 2007
8.235
+3.917
90.74%
jan 1, 2008
8.788
+0.554
6.72%
jan 1, 2009
5.271
-3.518
-40.02%
jan 1, 2010
-2.462
-7.733
-146.7%
jan 1, 2011
5.076
+7.537
-306.19%
jan 1, 2012
4.239
-0.836
-16.48%
jan 1, 2013
5.036
+0.796
18.79%
jan 1, 2014
1.456
-3.58
-71.09%
jan 1, 2015
2.495
+1.039
71.34%
jan 1, 2016
3.364
+0.87
34.86%
Ranking of countries by current statistics by years


Comments: