29
/
en
AIzaSyAYiBZKx7MnpbEhh9jyipgxe19OcubqV5w
April 1, 2024
210390
Nicaragua
NIC
true
2
1
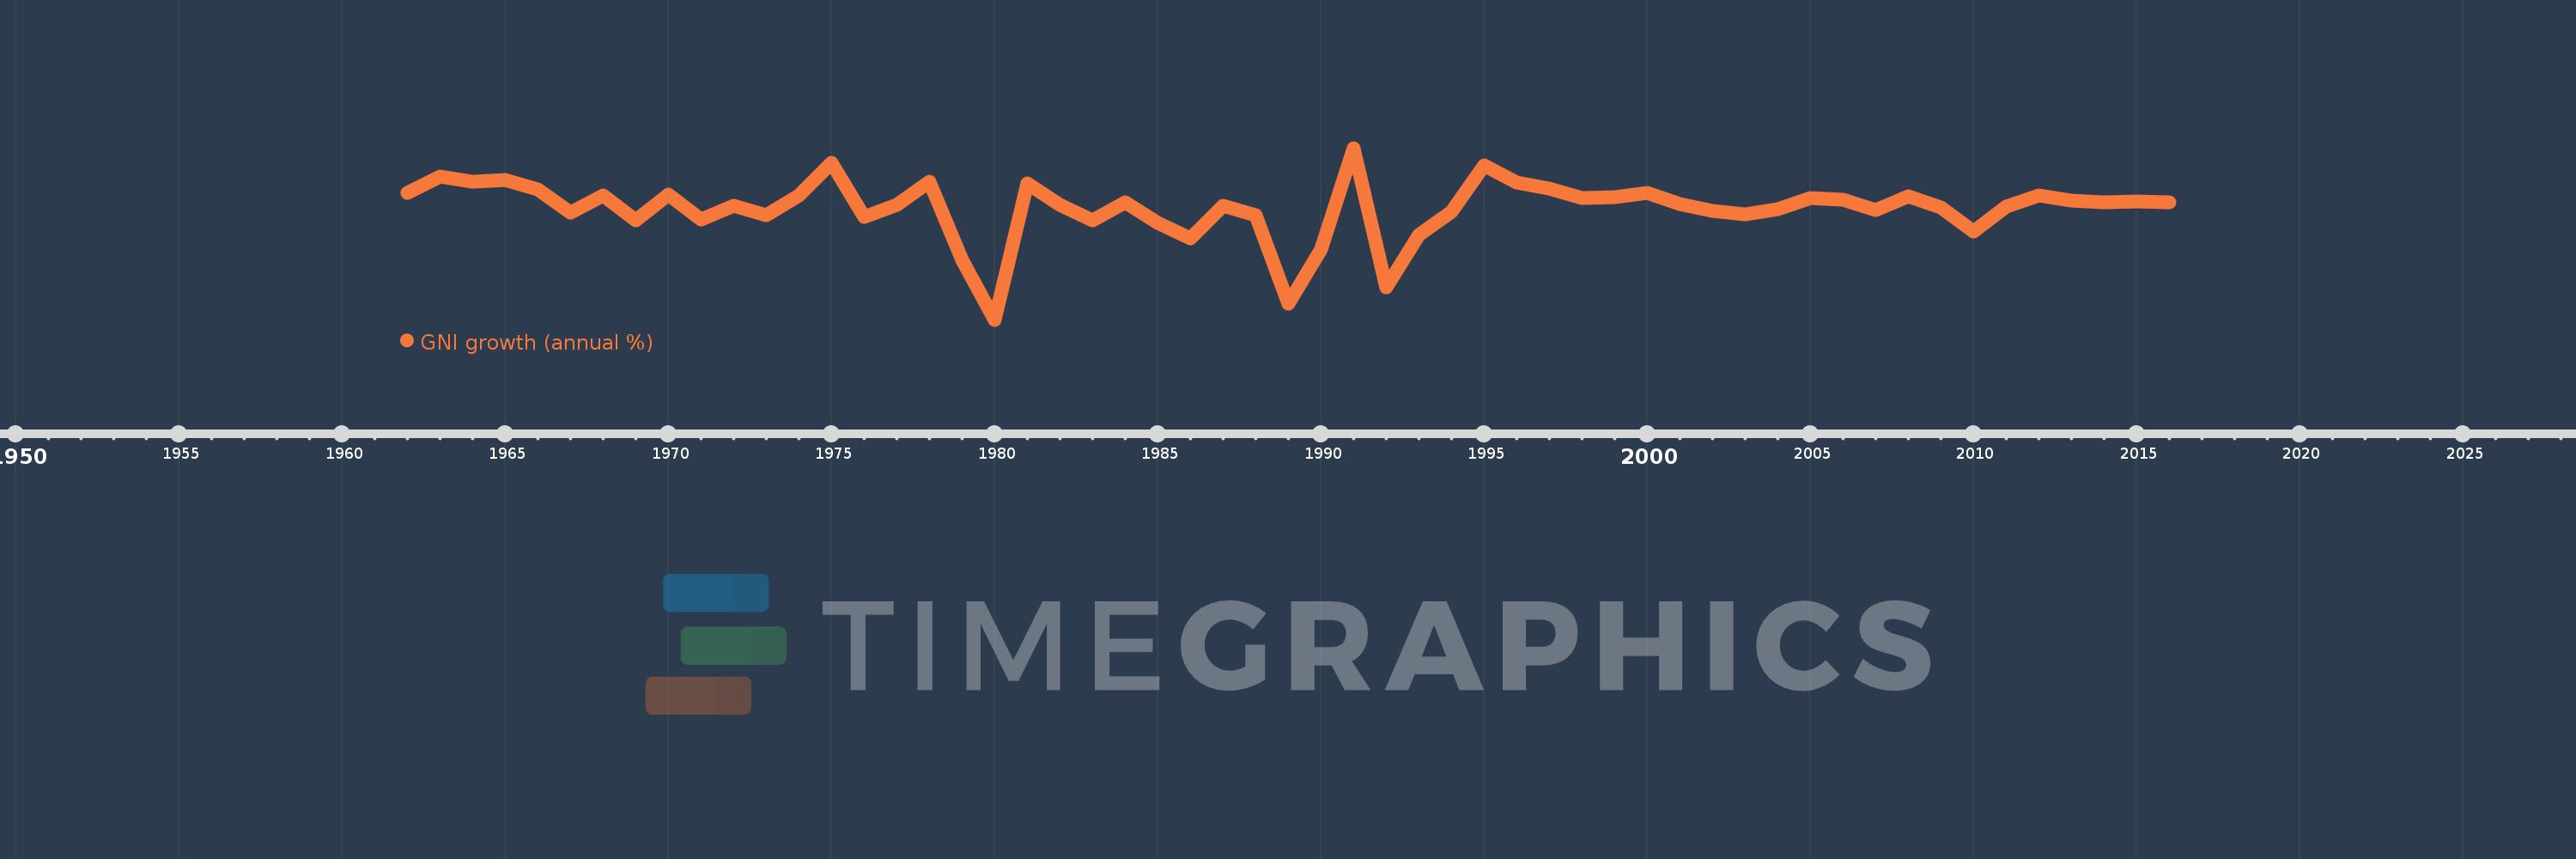
GNI growth (annual %)
2016,2015,2014,2013,2012,2011,2010,2009,2008,2007,2006,2005,2004,2003,2002,2001,2000,1999,1998,1997,1996,1995,1994,1993,1992,1991,1990,1989,1988,1987,1986,1985,1984,1983,1982,1981,1980,1979,1978,1977,1976,1975,1974,1973,1972,1971,1970,1969,1968,1967,1966,1965,1964,1963,1962
This statistics in other country:
AlbaniaAlgeriaAngolaAntigua and BarbudaArab WorldArgentinaArmeniaAustraliaAustriaAzerbaijanBahamas, TheBahrainBangladeshBarbadosBelarusBelgiumBelizeBeninBhutanBoliviaBosnia and HerzegovinaBotswanaBrazilBrunei DarussalamBulgariaBurkina FasoBurundiCabo VerdeCambodiaCameroonCanadaCaribbean small statesCentral Europe and the BalticsChadChileChinaColombiaComorosCongo, Dem. Rep.Congo, Rep.Costa RicaCote d'IvoireCroatiaCubaCyprusCzech RepublicDenmarkDjiboutiDominican RepublicEarly-demographic dividendEast Asia & PacificEast Asia & Pacific (excluding high income)East Asia & Pacific (IDA & IBRD countries)EcuadorEgypt, Arab Rep.El SalvadorEquatorial GuineaEritreaEstoniaEthiopiaEuro areaEurope & Central AsiaEurope & Central Asia (excluding high income)Europe & Central Asia (IDA & IBRD countries)European UnionFijiFinlandFranceGabonGambia, TheGeorgiaGermanyGhanaGreeceGuatemalaGuineaGuinea-BissauHaitiHeavily indebted poor countries (HIPC)High incomeHondurasHong Kong SAR, ChinaHungaryIBRD onlyIcelandIDA & IBRD totalIDA blendIDA onlyIDA totalIndiaIndonesiaIran, Islamic Rep.IrelandIsraelItalyJamaicaJapanJordanKazakhstanKenyaKorea, Rep.KosovoKuwaitKyrgyz RepublicLao PDRLate-demographic dividendLatin America & Caribbean Latin America & Caribbean (excluding high income)Latin America & the Caribbean (IDA & IBRD countries)LatviaLeast developed countries: UN classificationLebanonLiberiaLibyaLithuaniaLow & middle incomeLow incomeLower middle incomeLuxembourgMacao SAR, ChinaMacedonia, FYRMadagascarMalawiMalaysiaMaliMaltaMauritaniaMauritiusMexicoMiddle East & North AfricaMiddle East & North Africa (excluding high income)Middle East & North Africa (IDA & IBRD countries)Middle incomeMoldovaMongoliaMontenegroMoroccoMozambiqueMyanmarNamibiaNepalNetherlandsNew ZealandNicaraguaNigerNigeriaNorth AmericaNorwayOECD membersOmanOther small statesPakistanPanamaPapua New GuineaParaguayPeruPhilippinesPolandPortugalPost-demographic dividendPre-demographic dividendPuerto RicoQatarRomaniaRussian FederationRwandaSamoaSaudi ArabiaSenegalSerbiaSeychellesSierra LeoneSingaporeSlovak RepublicSloveniaSmall statesSomaliaSouth AfricaSouth AsiaSouth Asia (IDA & IBRD)South SudanSpainSri LankaSub-Saharan Africa Sub-Saharan Africa (excluding high income)Sub-Saharan Africa (IDA & IBRD countries)SudanSurinameSwazilandSwedenSwitzerlandSyrian Arab RepublicTajikistanTanzaniaThailandTimor-LesteTogoTrinidad and TobagoTunisiaTurkeyTurkmenistanUgandaUkraineUnited Arab EmiratesUnited KingdomUnited StatesUpper middle incomeUruguayUzbekistanVanuatuVenezuela, RBVietnamWest Bank and GazaWorldZambiaZimbabwe Timeline:
This timeline shows a graph from 1962 to 2016 of Nicaragua. No data until 1961. Number of actual observations by date: 55.
Source name:
World Development Indicators
Source organization:
World Bank national accounts data, and OECD National Accounts data files.
Categories, topics:
Economy & Growth
Last updated:
apr 23, 2017
Indicators value changes by year
Minimum:
-26.935
jan 1, 1980
Maximum:
19.262
jan 1, 1991
At the date of observation
Value
Absolute change
Change from previous value
jan 1, 1962
7.208
+7.208
0.0%
jan 1, 1963
11.579
+4.371
60.64%
jan 1, 1964
10.227
-1.352
-11.68%
jan 1, 1965
10.554
+0.328
3.2%
jan 1, 1966
8.07
-2.484
-23.54%
jan 1, 1967
1.909
-6.161
-76.35%
jan 1, 1968
6.43
+4.521
236.89%
jan 1, 1969
-0.228
-6.658
-103.55%
jan 1, 1970
6.659
+6.887
-3.01K%
jan 1, 1971
-0.067
-6.726
-101.0%
jan 1, 1972
3.697
+3.764
-5.63K%
jan 1, 1973
1.131
-2.566
-69.41%
jan 1, 1974
6.399
+5.267
465.66%
jan 1, 1975
15.358
+8.959
140.02%
jan 1, 1976
0.64
-14.718
-95.83%
jan 1, 1977
4.001
+3.361
525.14%
jan 1, 1978
10.24
+6.239
155.92%
jan 1, 1979
-10.874
-21.114
-206.19%
jan 1, 1980
-26.935
-16.061
147.7%
jan 1, 1981
9.672
+36.608
-135.91%
jan 1, 1982
4.031
-5.642
-58.33%
jan 1, 1983
-0.105
-4.136
-102.6%
jan 1, 1984
4.541
+4.646
-4.43K%
jan 1, 1985
-0.941
-5.482
-120.73%
jan 1, 1986
-5.018
-4.076
433.02%
jan 1, 1987
3.677
+8.695
-173.29%
jan 1, 1988
1.113
-2.564
-69.73%
jan 1, 1989
-22.641
-23.755
-2.13K%
jan 1, 1990
-8.052
+14.59
-64.44%
jan 1, 1991
19.262
+27.314
-339.23%
jan 1, 1992
-18.315
-37.577
-195.08%
jan 1, 1993
-4.2
+14.115
-77.07%
jan 1, 1994
2.044
+6.244
-148.66%
jan 1, 1995
14.485
+12.441
608.65%
jan 1, 1996
10.068
-4.418
-30.5%
jan 1, 1997
8.316
-1.752
-17.4%
jan 1, 1998
5.739
-2.576
-30.98%
jan 1, 1999
6.029
+0.29
5.05%
jan 1, 2000
7.086
+1.056
17.52%
jan 1, 2001
4.264
-2.822
-39.82%
jan 1, 2002
2.354
-1.91
-44.79%
jan 1, 2003
1.386
-0.968
-41.13%
jan 1, 2004
2.805
+1.419
102.36%
jan 1, 2005
5.819
+3.014
107.45%
jan 1, 2006
5.332
-0.488
-8.38%
jan 1, 2007
2.57
-2.761
-51.79%
jan 1, 2008
6.212
+3.642
141.7%
jan 1, 2009
3.223
-2.989
-48.12%
jan 1, 2010
-3.28
-6.503
-201.76%
jan 1, 2011
3.491
+6.77
-206.43%
jan 1, 2012
6.425
+2.935
84.07%
jan 1, 2013
5.002
-1.423
-22.15%
jan 1, 2014
4.718
-0.284
-5.68%
jan 1, 2015
4.914
+0.196
4.15%
jan 1, 2016
4.742
-0.172
-3.51%
Ranking of countries by current statistics by years


Comments: