29
/
en
AIzaSyAYiBZKx7MnpbEhh9jyipgxe19OcubqV5w
April 1, 2024
103627
Chad
TCD
true
2
1
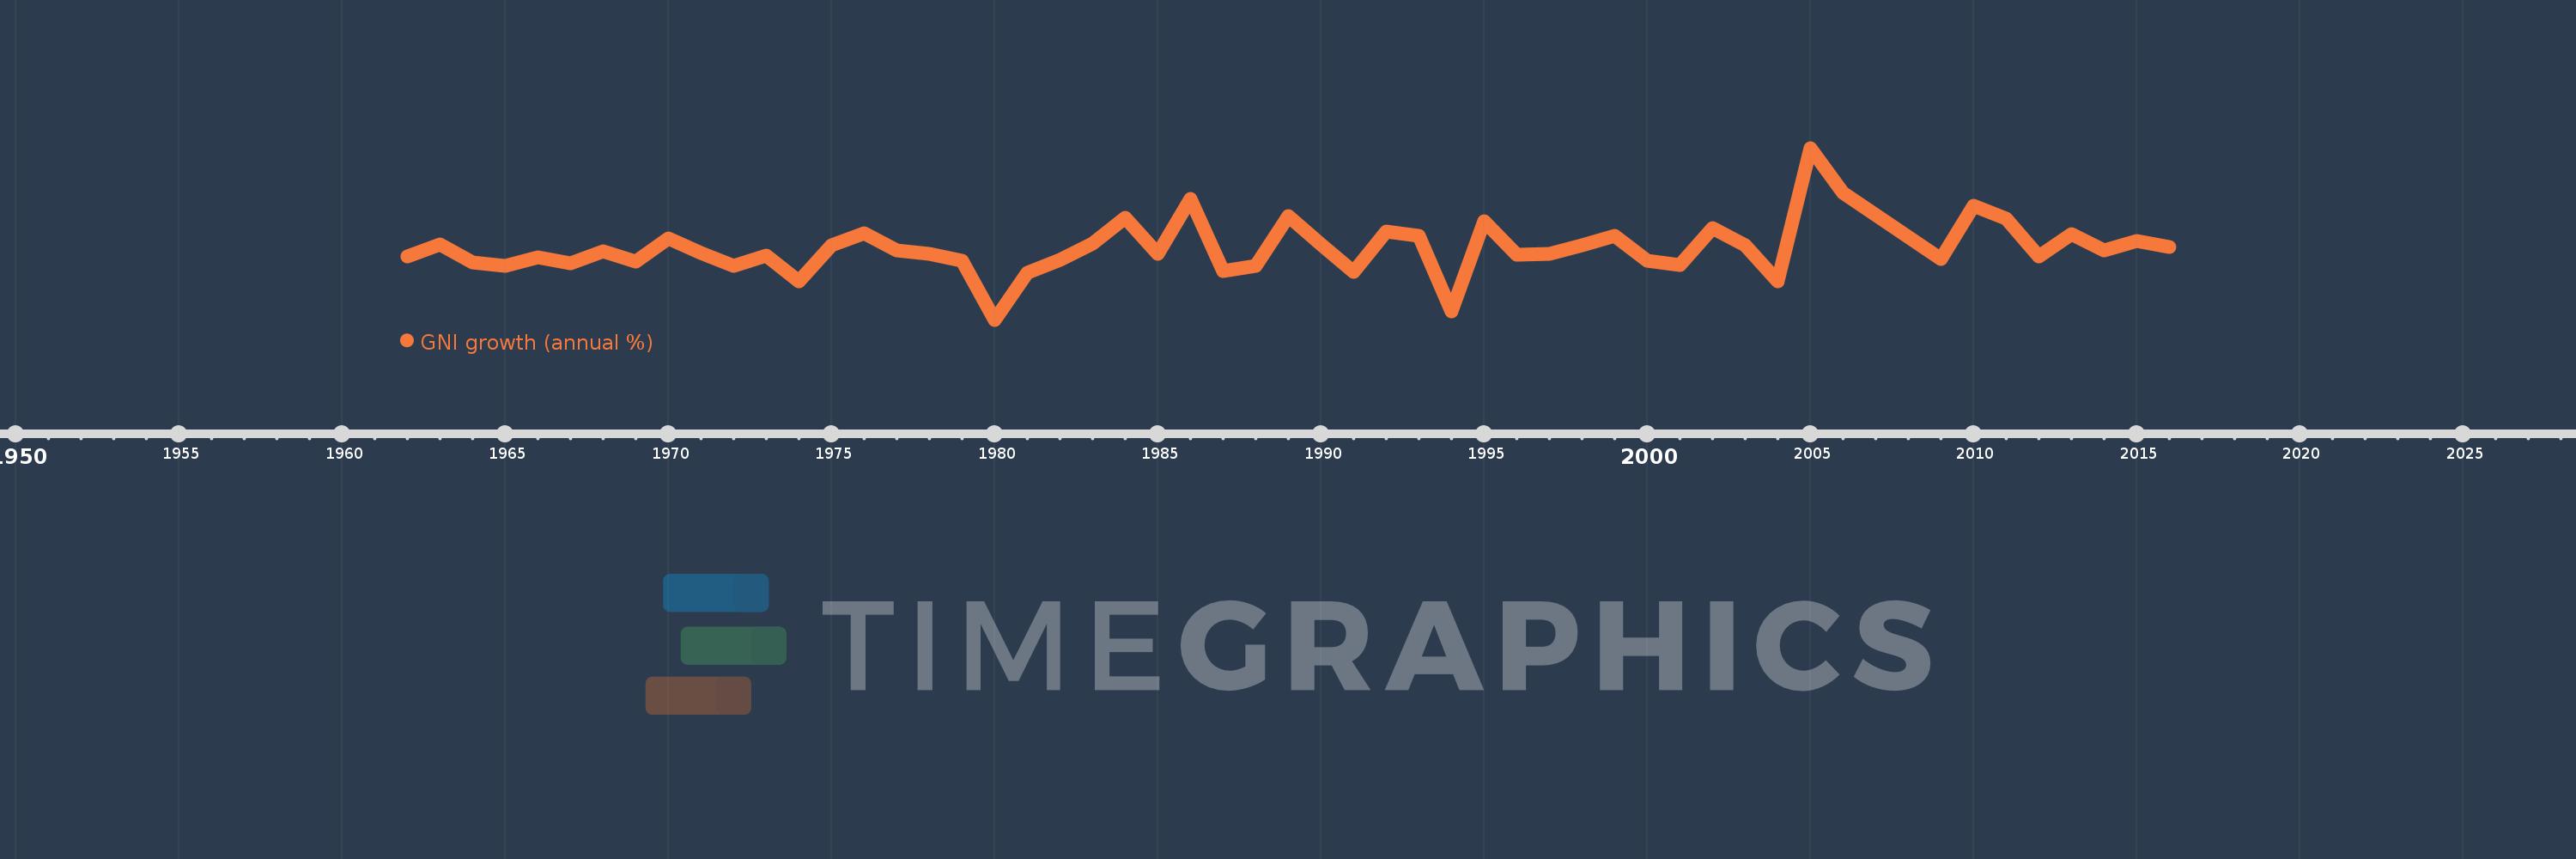
GNI growth (annual %)
2016,2015,2014,2013,2012,2011,2010,2009,2006,2005,2004,2003,2002,2001,2000,1999,1998,1997,1996,1995,1994,1993,1992,1991,1990,1989,1988,1987,1986,1985,1984,1983,1982,1981,1980,1979,1978,1977,1976,1975,1974,1973,1972,1971,1970,1969,1968,1967,1966,1965,1964,1963,1962
This statistics in other country:
AlbaniaAlgeriaAngolaAntigua and BarbudaArab WorldArgentinaArmeniaAustraliaAustriaAzerbaijanBahamas, TheBahrainBangladeshBarbadosBelarusBelgiumBelizeBeninBhutanBoliviaBosnia and HerzegovinaBotswanaBrazilBrunei DarussalamBulgariaBurkina FasoBurundiCabo VerdeCambodiaCameroonCanadaCaribbean small statesCentral Europe and the BalticsChadChileChinaColombiaComorosCongo, Dem. Rep.Congo, Rep.Costa RicaCote d'IvoireCroatiaCubaCyprusCzech RepublicDenmarkDjiboutiDominican RepublicEarly-demographic dividendEast Asia & PacificEast Asia & Pacific (excluding high income)East Asia & Pacific (IDA & IBRD countries)EcuadorEgypt, Arab Rep.El SalvadorEquatorial GuineaEritreaEstoniaEthiopiaEuro areaEurope & Central AsiaEurope & Central Asia (excluding high income)Europe & Central Asia (IDA & IBRD countries)European UnionFijiFinlandFranceGabonGambia, TheGeorgiaGermanyGhanaGreeceGuatemalaGuineaGuinea-BissauHaitiHeavily indebted poor countries (HIPC)High incomeHondurasHong Kong SAR, ChinaHungaryIBRD onlyIcelandIDA & IBRD totalIDA blendIDA onlyIDA totalIndiaIndonesiaIran, Islamic Rep.IrelandIsraelItalyJamaicaJapanJordanKazakhstanKenyaKorea, Rep.KosovoKuwaitKyrgyz RepublicLao PDRLate-demographic dividendLatin America & Caribbean Latin America & Caribbean (excluding high income)Latin America & the Caribbean (IDA & IBRD countries)LatviaLeast developed countries: UN classificationLebanonLiberiaLibyaLithuaniaLow & middle incomeLow incomeLower middle incomeLuxembourgMacao SAR, ChinaMacedonia, FYRMadagascarMalawiMalaysiaMaliMaltaMauritaniaMauritiusMexicoMiddle East & North AfricaMiddle East & North Africa (excluding high income)Middle East & North Africa (IDA & IBRD countries)Middle incomeMoldovaMongoliaMontenegroMoroccoMozambiqueMyanmarNamibiaNepalNetherlandsNew ZealandNicaraguaNigerNigeriaNorth AmericaNorwayOECD membersOmanOther small statesPakistanPanamaPapua New GuineaParaguayPeruPhilippinesPolandPortugalPost-demographic dividendPre-demographic dividendPuerto RicoQatarRomaniaRussian FederationRwandaSamoaSaudi ArabiaSenegalSerbiaSeychellesSierra LeoneSingaporeSlovak RepublicSloveniaSmall statesSomaliaSouth AfricaSouth AsiaSouth Asia (IDA & IBRD)South SudanSpainSri LankaSub-Saharan Africa Sub-Saharan Africa (excluding high income)Sub-Saharan Africa (IDA & IBRD countries)SudanSurinameSwazilandSwedenSwitzerlandSyrian Arab RepublicTajikistanTanzaniaThailandTimor-LesteTogoTrinidad and TobagoTunisiaTurkeyTurkmenistanUgandaUkraineUnited Arab EmiratesUnited KingdomUnited StatesUpper middle incomeUruguayUzbekistanVanuatuVenezuela, RBVietnamWest Bank and GazaWorldZambiaZimbabwe Timeline:
This timeline shows a graph from 1962 to 2016 of Chad. No data until 1961. Number of actual observations by date: 53.
Source name:
World Development Indicators
Source organization:
World Bank national accounts data, and OECD National Accounts data files.
Categories, topics:
Economy & Growth
Last updated:
apr 23, 2017
Indicators value changes by year
Minimum:
-22.311
jan 1, 1980
Maximum:
40.644
jan 1, 2005
At the date of observation
Value
Absolute change
Change from previous value
jan 1, 1962
0.951
+0.951
0.0%
jan 1, 1963
5.245
+4.294
451.42%
jan 1, 1964
-1.466
-6.711
-127.95%
jan 1, 1965
-2.431
-0.965
65.82%
jan 1, 1966
0.616
+3.047
-125.35%
jan 1, 1967
-1.708
-2.324
-377.12%
jan 1, 1968
2.706
+4.414
-258.48%
jan 1, 1969
-0.971
-3.677
-135.88%
jan 1, 1970
7.393
+8.364
-861.46%
jan 1, 1971
2.183
-5.21
-70.47%
jan 1, 1972
-2.423
-4.606
-211.0%
jan 1, 1973
1.345
+3.768
-155.51%
jan 1, 1974
-8.395
-9.74
-724.11%
jan 1, 1975
4.963
+13.358
-159.11%
jan 1, 1976
9.371
+4.409
88.84%
jan 1, 1977
3.066
-6.306
-67.29%
jan 1, 1978
1.776
-1.29
-42.08%
jan 1, 1979
-0.669
-2.444
-137.66%
jan 1, 1980
-22.311
-21.642
3.24K%
jan 1, 1981
-5.038
+17.273
-77.42%
jan 1, 1982
-0.253
+4.785
-94.97%
jan 1, 1983
5.548
+5.802
-2.29K%
jan 1, 1984
14.975
+9.427
169.91%
jan 1, 1985
1.871
-13.105
-87.51%
jan 1, 1986
22.089
+20.219
1.08K%
jan 1, 1987
-4.55
-26.64
-120.6%
jan 1, 1988
-2.496
+2.054
-45.14%
jan 1, 1989
15.525
+18.022
-721.89%
jan 1, 1990
5.374
-10.151
-65.38%
jan 1, 1991
-4.772
-10.147
-188.8%
jan 1, 1992
10.09
+14.862
-311.43%
jan 1, 1993
8.447
-1.643
-16.28%
jan 1, 1994
-19.19
-27.637
-327.18%
jan 1, 1995
13.651
+32.841
-171.13%
jan 1, 1996
1.659
-11.992
-87.85%
jan 1, 1997
1.872
+0.213
12.86%
jan 1, 1998
5.067
+3.195
170.66%
jan 1, 1999
8.341
+3.274
64.61%
jan 1, 2000
-0.767
-9.108
-109.2%
jan 1, 2001
-2.354
-1.586
206.77%
jan 1, 2002
11.387
+13.741
-583.79%
jan 1, 2003
4.861
-6.526
-57.31%
jan 1, 2004
-8.247
-13.108
-269.67%
jan 1, 2005
40.644
+48.891
-592.83%
jan 1, 2006
24.293
-16.351
-40.23%
jan 1, 2009
-0.042
-24.335
-100.17%
jan 1, 2010
19.491
+19.533
-46.55K%
jan 1, 2011
14.631
-4.86
-24.93%
jan 1, 2012
0.879
-13.752
-93.99%
jan 1, 2013
9.019
+8.14
925.91%
jan 1, 2014
3.233
-5.785
-64.15%
jan 1, 2015
6.52
+3.287
101.64%
jan 1, 2016
4.495
-2.025
-31.06%
Ranking of countries by current statistics by years


Comments: