29
/
en
AIzaSyAYiBZKx7MnpbEhh9jyipgxe19OcubqV5w
April 1, 2024
167514
Kenya
KEN
true
2
1
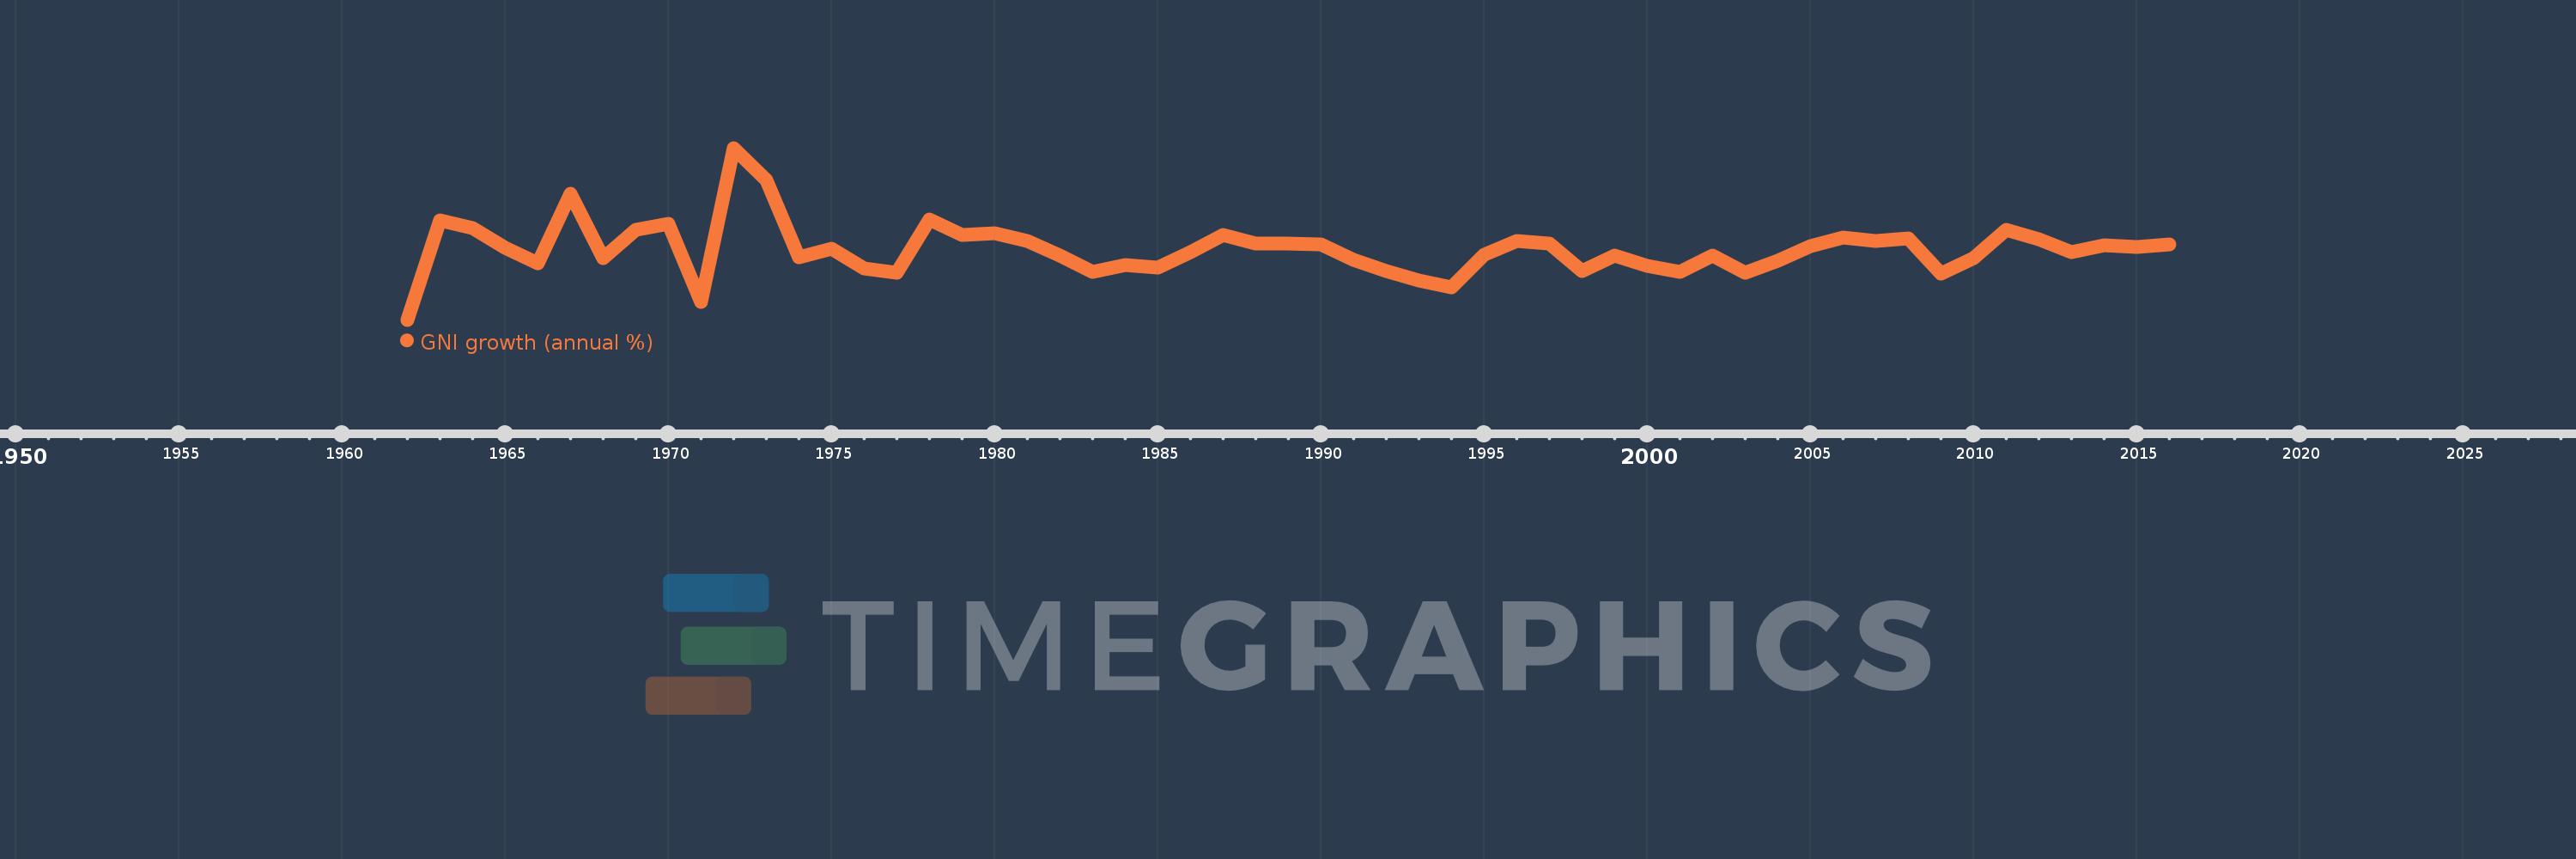
GNI growth (annual %)
2016,2015,2014,2013,2012,2011,2010,2009,2008,2007,2006,2005,2004,2003,2002,2001,2000,1999,1998,1997,1996,1995,1994,1993,1992,1991,1990,1989,1988,1987,1986,1985,1984,1983,1982,1981,1980,1979,1978,1977,1976,1975,1974,1973,1972,1971,1970,1969,1968,1967,1966,1965,1964,1963,1962
This statistics in other country:
AlbaniaAlgeriaAngolaAntigua and BarbudaArab WorldArgentinaArmeniaAustraliaAustriaAzerbaijanBahamas, TheBahrainBangladeshBarbadosBelarusBelgiumBelizeBeninBhutanBoliviaBosnia and HerzegovinaBotswanaBrazilBrunei DarussalamBulgariaBurkina FasoBurundiCabo VerdeCambodiaCameroonCanadaCaribbean small statesCentral Europe and the BalticsChadChileChinaColombiaComorosCongo, Dem. Rep.Congo, Rep.Costa RicaCote d'IvoireCroatiaCubaCyprusCzech RepublicDenmarkDjiboutiDominican RepublicEarly-demographic dividendEast Asia & PacificEast Asia & Pacific (excluding high income)East Asia & Pacific (IDA & IBRD countries)EcuadorEgypt, Arab Rep.El SalvadorEquatorial GuineaEritreaEstoniaEthiopiaEuro areaEurope & Central AsiaEurope & Central Asia (excluding high income)Europe & Central Asia (IDA & IBRD countries)European UnionFijiFinlandFranceGabonGambia, TheGeorgiaGermanyGhanaGreeceGuatemalaGuineaGuinea-BissauHaitiHeavily indebted poor countries (HIPC)High incomeHondurasHong Kong SAR, ChinaHungaryIBRD onlyIcelandIDA & IBRD totalIDA blendIDA onlyIDA totalIndiaIndonesiaIran, Islamic Rep.IrelandIsraelItalyJamaicaJapanJordanKazakhstanKenyaKorea, Rep.KosovoKuwaitKyrgyz RepublicLao PDRLate-demographic dividendLatin America & Caribbean Latin America & Caribbean (excluding high income)Latin America & the Caribbean (IDA & IBRD countries)LatviaLeast developed countries: UN classificationLebanonLiberiaLibyaLithuaniaLow & middle incomeLow incomeLower middle incomeLuxembourgMacao SAR, ChinaMacedonia, FYRMadagascarMalawiMalaysiaMaliMaltaMauritaniaMauritiusMexicoMiddle East & North AfricaMiddle East & North Africa (excluding high income)Middle East & North Africa (IDA & IBRD countries)Middle incomeMoldovaMongoliaMontenegroMoroccoMozambiqueMyanmarNamibiaNepalNetherlandsNew ZealandNicaraguaNigerNigeriaNorth AmericaNorwayOECD membersOmanOther small statesPakistanPanamaPapua New GuineaParaguayPeruPhilippinesPolandPortugalPost-demographic dividendPre-demographic dividendPuerto RicoQatarRomaniaRussian FederationRwandaSamoaSaudi ArabiaSenegalSerbiaSeychellesSierra LeoneSingaporeSlovak RepublicSloveniaSmall statesSomaliaSouth AfricaSouth AsiaSouth Asia (IDA & IBRD)South SudanSpainSri LankaSub-Saharan Africa Sub-Saharan Africa (excluding high income)Sub-Saharan Africa (IDA & IBRD countries)SudanSurinameSwazilandSwedenSwitzerlandSyrian Arab RepublicTajikistanTanzaniaThailandTimor-LesteTogoTrinidad and TobagoTunisiaTurkeyTurkmenistanUgandaUkraineUnited Arab EmiratesUnited KingdomUnited StatesUpper middle incomeUruguayUzbekistanVanuatuVenezuela, RBVietnamWest Bank and GazaWorldZambiaZimbabwe Timeline:
This timeline shows a graph from 1962 to 2016 of Kenya. No data until 1961. Number of actual observations by date: 55.
Source name:
World Development Indicators
Source organization:
World Bank national accounts data, and OECD National Accounts data files.
Categories, topics:
Economy & Growth
Last updated:
apr 23, 2017
Indicators value changes by year
Minimum:
-7.378
jan 1, 1962
Maximum:
22.268
jan 1, 1972
At the date of observation
Value
Absolute change
Change from previous value
jan 1, 1962
-7.378
-7.378
0.0%
jan 1, 1963
9.747
+17.125
-232.11%
jan 1, 1964
8.43
-1.318
-13.52%
jan 1, 1965
4.968
-3.462
-41.07%
jan 1, 1966
2.403
-2.564
-51.62%
jan 1, 1967
14.326
+11.923
496.11%
jan 1, 1968
3.193
-11.133
-77.71%
jan 1, 1969
8.212
+5.019
157.18%
jan 1, 1970
9.179
+0.967
11.77%
jan 1, 1971
-4.312
-13.491
-146.98%
jan 1, 1972
22.268
+26.581
-616.41%
jan 1, 1973
16.777
-5.491
-24.66%
jan 1, 1974
3.332
-13.445
-80.14%
jan 1, 1975
4.952
+1.62
48.63%
jan 1, 1976
1.434
-3.519
-71.05%
jan 1, 1977
0.776
-0.657
-45.84%
jan 1, 1978
9.854
+9.077
1.17K%
jan 1, 1979
7.205
-2.649
-26.88%
jan 1, 1980
7.54
+0.335
4.65%
jan 1, 1981
6.149
-1.392
-18.46%
jan 1, 1982
3.701
-2.448
-39.81%
jan 1, 1983
0.854
-2.847
-76.93%
jan 1, 1984
2.018
+1.165
136.43%
jan 1, 1985
1.691
-0.327
-16.2%
jan 1, 1986
4.223
+2.532
149.7%
jan 1, 1987
7.236
+3.013
71.34%
jan 1, 1988
5.714
-1.522
-21.03%
jan 1, 1989
5.826
+0.111
1.94%
jan 1, 1990
5.663
-0.162
-2.79%
jan 1, 1991
2.997
-2.666
-47.07%
jan 1, 1992
0.982
-2.016
-67.25%
jan 1, 1993
-0.586
-1.568
-159.73%
jan 1, 1994
-1.72
-1.134
193.42%
jan 1, 1995
3.824
+5.545
-322.29%
jan 1, 1996
6.177
+2.352
61.51%
jan 1, 1997
5.813
-0.363
-5.88%
jan 1, 1998
0.97
-4.844
-83.32%
jan 1, 1999
3.657
+2.687
277.08%
jan 1, 2000
1.893
-1.765
-48.25%
jan 1, 2001
0.941
-0.952
-50.29%
jan 1, 2002
3.636
+2.695
286.42%
jan 1, 2003
0.746
-2.89
-79.49%
jan 1, 2004
2.765
+2.019
270.79%
jan 1, 2005
5.342
+2.577
93.18%
jan 1, 2006
6.753
+1.412
26.43%
jan 1, 2007
6.227
-0.526
-7.79%
jan 1, 2008
6.671
+0.444
7.12%
jan 1, 2009
0.579
-6.091
-91.31%
jan 1, 2010
3.27
+2.69
464.24%
jan 1, 2011
8.141
+4.871
148.98%
jan 1, 2012
6.514
-1.627
-19.99%
jan 1, 2013
4.239
-2.275
-34.93%
jan 1, 2014
5.418
+1.179
27.82%
jan 1, 2015
5.231
-0.187
-3.45%
jan 1, 2016
5.588
+0.357
6.82%
Ranking of countries by current statistics by years


Comments: