29
/
en
AIzaSyAYiBZKx7MnpbEhh9jyipgxe19OcubqV5w
April 1, 2024
68818
Antigua and Barbuda
ATG
true
2
1
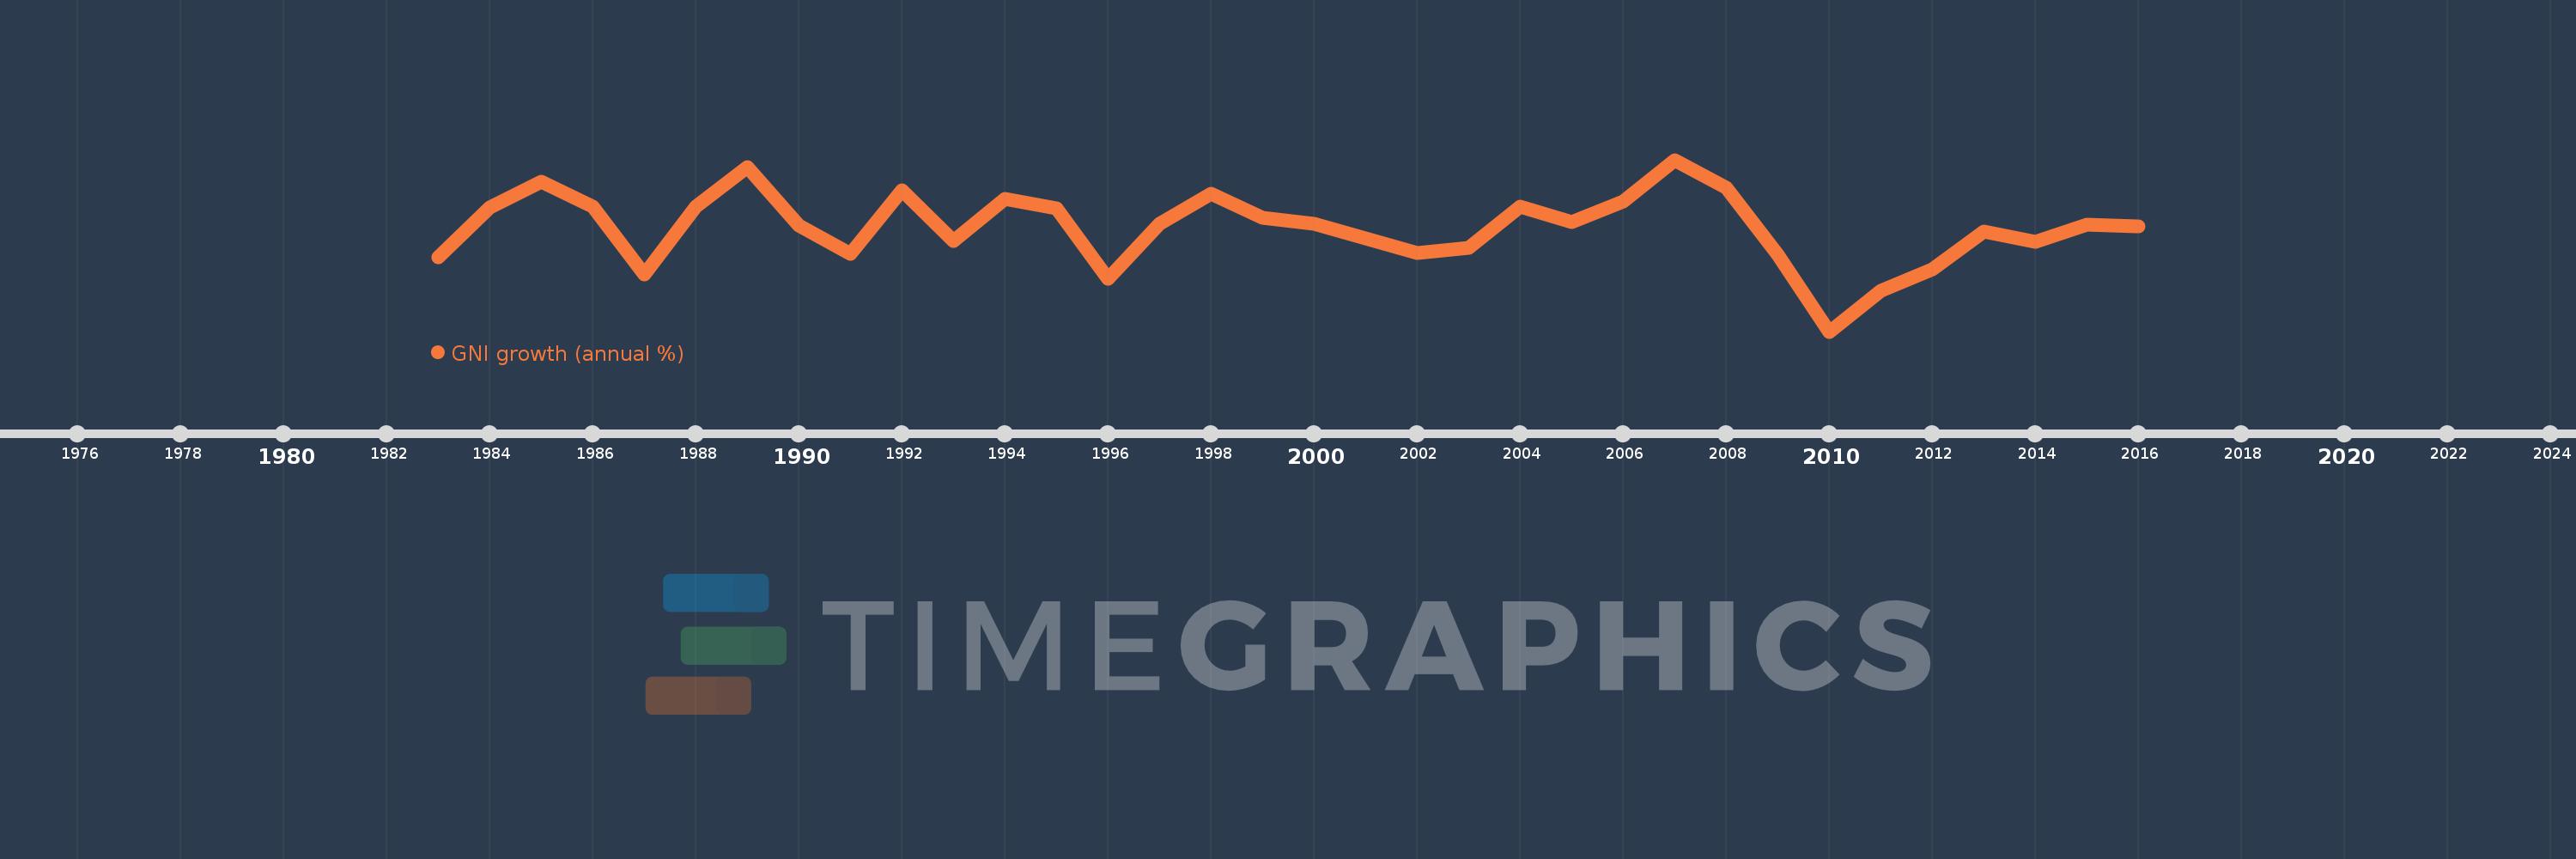
GNI growth (annual %)
2016,2015,2014,2013,2012,2011,2010,2009,2008,2007,2006,2005,2004,2003,2002,2001,2000,1999,1998,1997,1996,1995,1994,1993,1992,1991,1990,1989,1988,1987,1986,1985,1984,1983
This statistics in other country:
AlbaniaAlgeriaAngolaAntigua and BarbudaArab WorldArgentinaArmeniaAustraliaAustriaAzerbaijanBahamas, TheBahrainBangladeshBarbadosBelarusBelgiumBelizeBeninBhutanBoliviaBosnia and HerzegovinaBotswanaBrazilBrunei DarussalamBulgariaBurkina FasoBurundiCabo VerdeCambodiaCameroonCanadaCaribbean small statesCentral Europe and the BalticsChadChileChinaColombiaComorosCongo, Dem. Rep.Congo, Rep.Costa RicaCote d'IvoireCroatiaCubaCyprusCzech RepublicDenmarkDjiboutiDominican RepublicEarly-demographic dividendEast Asia & PacificEast Asia & Pacific (excluding high income)East Asia & Pacific (IDA & IBRD countries)EcuadorEgypt, Arab Rep.El SalvadorEquatorial GuineaEritreaEstoniaEthiopiaEuro areaEurope & Central AsiaEurope & Central Asia (excluding high income)Europe & Central Asia (IDA & IBRD countries)European UnionFijiFinlandFranceGabonGambia, TheGeorgiaGermanyGhanaGreeceGuatemalaGuineaGuinea-BissauHaitiHeavily indebted poor countries (HIPC)High incomeHondurasHong Kong SAR, ChinaHungaryIBRD onlyIcelandIDA & IBRD totalIDA blendIDA onlyIDA totalIndiaIndonesiaIran, Islamic Rep.IrelandIsraelItalyJamaicaJapanJordanKazakhstanKenyaKorea, Rep.KosovoKuwaitKyrgyz RepublicLao PDRLate-demographic dividendLatin America & Caribbean Latin America & Caribbean (excluding high income)Latin America & the Caribbean (IDA & IBRD countries)LatviaLeast developed countries: UN classificationLebanonLiberiaLibyaLithuaniaLow & middle incomeLow incomeLower middle incomeLuxembourgMacao SAR, ChinaMacedonia, FYRMadagascarMalawiMalaysiaMaliMaltaMauritaniaMauritiusMexicoMiddle East & North AfricaMiddle East & North Africa (excluding high income)Middle East & North Africa (IDA & IBRD countries)Middle incomeMoldovaMongoliaMontenegroMoroccoMozambiqueMyanmarNamibiaNepalNetherlandsNew ZealandNicaraguaNigerNigeriaNorth AmericaNorwayOECD membersOmanOther small statesPakistanPanamaPapua New GuineaParaguayPeruPhilippinesPolandPortugalPost-demographic dividendPre-demographic dividendPuerto RicoQatarRomaniaRussian FederationRwandaSamoaSaudi ArabiaSenegalSerbiaSeychellesSierra LeoneSingaporeSlovak RepublicSloveniaSmall statesSomaliaSouth AfricaSouth AsiaSouth Asia (IDA & IBRD)South SudanSpainSri LankaSub-Saharan Africa Sub-Saharan Africa (excluding high income)Sub-Saharan Africa (IDA & IBRD countries)SudanSurinameSwazilandSwedenSwitzerlandSyrian Arab RepublicTajikistanTanzaniaThailandTimor-LesteTogoTrinidad and TobagoTunisiaTurkeyTurkmenistanUgandaUkraineUnited Arab EmiratesUnited KingdomUnited StatesUpper middle incomeUruguayUzbekistanVanuatuVenezuela, RBVietnamWest Bank and GazaWorldZambiaZimbabwe Timeline:
This timeline shows a graph from 1983 to 2016 of Antigua and Barbuda. No data until 1982. Number of actual observations by date: 34.
Source name:
World Development Indicators
Source organization:
World Bank national accounts data, and OECD National Accounts data files.
Categories, topics:
Economy & Growth
Last updated:
apr 23, 2017
Indicators value changes by year
Minimum:
-11.75
jan 1, 2010
Maximum:
13.673
jan 1, 2007
At the date of observation
Value
Absolute change
Change from previous value
jan 1, 1983
-0.758
-0.758
0.0%
jan 1, 1984
6.589
+7.347
-969.37%
jan 1, 1985
10.413
+3.823
58.03%
jan 1, 1986
6.767
-3.645
-35.01%
jan 1, 1987
-3.358
-10.125
-149.63%
jan 1, 1988
6.762
+10.12
-301.34%
jan 1, 1989
12.606
+5.844
86.42%
jan 1, 1990
3.9
-8.705
-69.06%
jan 1, 1991
-0.189
-4.089
-104.84%
jan 1, 1992
9.21
+9.398
-4.98K%
jan 1, 1993
1.715
-7.494
-81.38%
jan 1, 1994
7.934
+6.218
362.56%
jan 1, 1995
6.477
-1.456
-18.35%
jan 1, 1996
-3.936
-10.414
-160.77%
jan 1, 1997
4.14
+8.077
-205.18%
jan 1, 1998
8.683
+4.543
109.72%
jan 1, 1999
5.054
-3.629
-41.79%
jan 1, 2000
4.146
-0.908
-17.97%
jan 1, 2001
2.055
-2.091
-50.43%
jan 1, 2002
-0.07
-2.125
-103.41%
jan 1, 2003
0.625
+0.695
-993.11%
jan 1, 2004
6.792
+6.167
986.08%
jan 1, 2005
4.494
-2.298
-33.84%
jan 1, 2006
7.53
+3.036
67.56%
jan 1, 2007
13.673
+6.144
81.59%
jan 1, 2008
9.558
-4.115
-30.09%
jan 1, 2009
-0.41
-9.968
-104.29%
jan 1, 2010
-11.75
-11.34
2.77K%
jan 1, 2011
-5.742
+6.008
-51.13%
jan 1, 2012
-2.521
+3.221
-56.1%
jan 1, 2013
3.036
+5.557
-220.42%
jan 1, 2014
1.529
-1.507
-49.64%
jan 1, 2015
4.098
+2.569
168.07%
jan 1, 2016
3.78
-0.318
-7.76%
Ranking of countries by current statistics by years


Comments: