29
/
en
AIzaSyAYiBZKx7MnpbEhh9jyipgxe19OcubqV5w
April 1, 2024
225922
Portugal
PRT
true
2
1
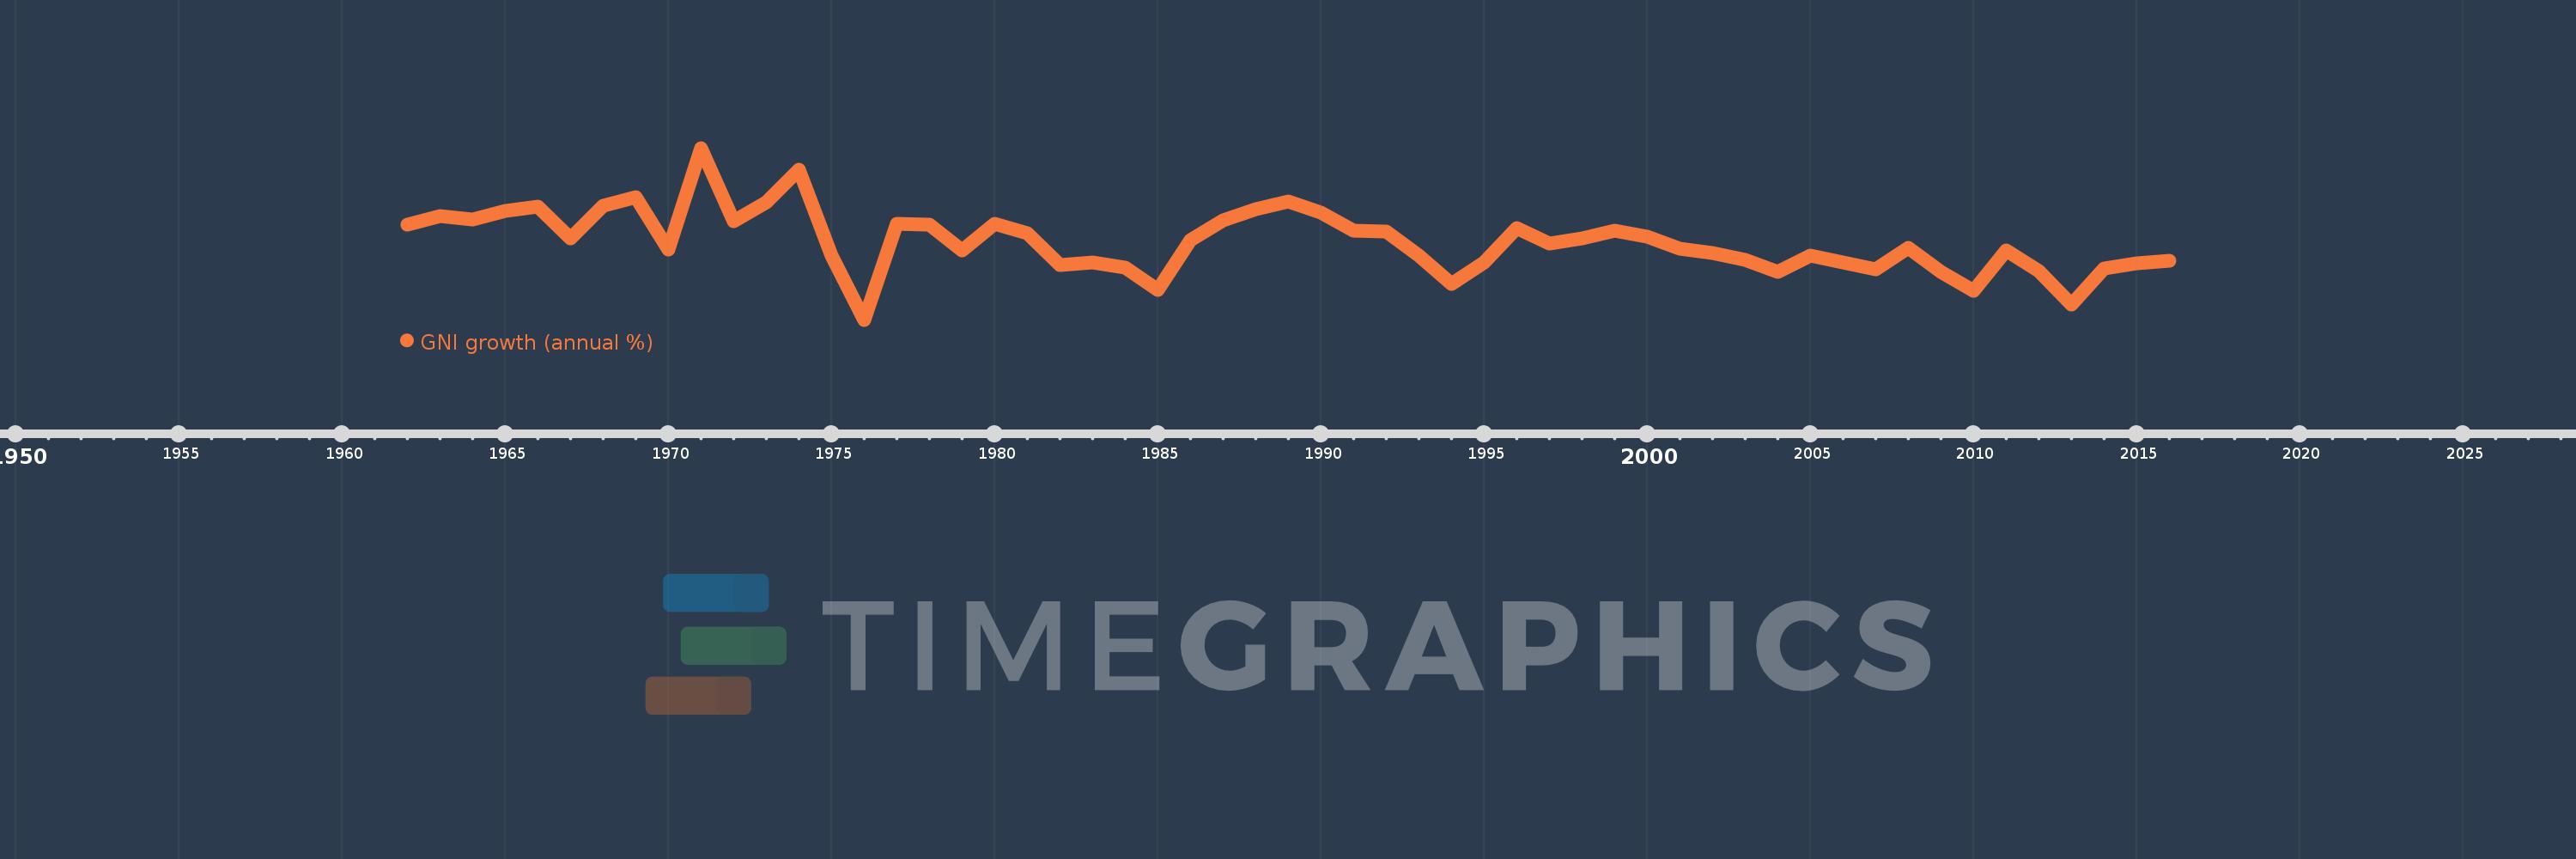
GNI growth (annual %)
2016,2015,2014,2013,2012,2011,2010,2009,2008,2007,2006,2005,2004,2003,2002,2001,2000,1999,1998,1997,1996,1995,1994,1993,1992,1991,1990,1989,1988,1987,1986,1985,1984,1983,1982,1981,1980,1979,1978,1977,1976,1975,1974,1973,1972,1971,1970,1969,1968,1967,1966,1965,1964,1963,1962
This statistics in other country:
AlbaniaAlgeriaAngolaAntigua and BarbudaArab WorldArgentinaArmeniaAustraliaAustriaAzerbaijanBahamas, TheBahrainBangladeshBarbadosBelarusBelgiumBelizeBeninBhutanBoliviaBosnia and HerzegovinaBotswanaBrazilBrunei DarussalamBulgariaBurkina FasoBurundiCabo VerdeCambodiaCameroonCanadaCaribbean small statesCentral Europe and the BalticsChadChileChinaColombiaComorosCongo, Dem. Rep.Congo, Rep.Costa RicaCote d'IvoireCroatiaCubaCyprusCzech RepublicDenmarkDjiboutiDominican RepublicEarly-demographic dividendEast Asia & PacificEast Asia & Pacific (excluding high income)East Asia & Pacific (IDA & IBRD countries)EcuadorEgypt, Arab Rep.El SalvadorEquatorial GuineaEritreaEstoniaEthiopiaEuro areaEurope & Central AsiaEurope & Central Asia (excluding high income)Europe & Central Asia (IDA & IBRD countries)European UnionFijiFinlandFranceGabonGambia, TheGeorgiaGermanyGhanaGreeceGuatemalaGuineaGuinea-BissauHaitiHeavily indebted poor countries (HIPC)High incomeHondurasHong Kong SAR, ChinaHungaryIBRD onlyIcelandIDA & IBRD totalIDA blendIDA onlyIDA totalIndiaIndonesiaIran, Islamic Rep.IrelandIsraelItalyJamaicaJapanJordanKazakhstanKenyaKorea, Rep.KosovoKuwaitKyrgyz RepublicLao PDRLate-demographic dividendLatin America & Caribbean Latin America & Caribbean (excluding high income)Latin America & the Caribbean (IDA & IBRD countries)LatviaLeast developed countries: UN classificationLebanonLiberiaLibyaLithuaniaLow & middle incomeLow incomeLower middle incomeLuxembourgMacao SAR, ChinaMacedonia, FYRMadagascarMalawiMalaysiaMaliMaltaMauritaniaMauritiusMexicoMiddle East & North AfricaMiddle East & North Africa (excluding high income)Middle East & North Africa (IDA & IBRD countries)Middle incomeMoldovaMongoliaMontenegroMoroccoMozambiqueMyanmarNamibiaNepalNetherlandsNew ZealandNicaraguaNigerNigeriaNorth AmericaNorwayOECD membersOmanOther small statesPakistanPanamaPapua New GuineaParaguayPeruPhilippinesPolandPortugalPost-demographic dividendPre-demographic dividendPuerto RicoQatarRomaniaRussian FederationRwandaSamoaSaudi ArabiaSenegalSerbiaSeychellesSierra LeoneSingaporeSlovak RepublicSloveniaSmall statesSomaliaSouth AfricaSouth AsiaSouth Asia (IDA & IBRD)South SudanSpainSri LankaSub-Saharan Africa Sub-Saharan Africa (excluding high income)Sub-Saharan Africa (IDA & IBRD countries)SudanSurinameSwazilandSwedenSwitzerlandSyrian Arab RepublicTajikistanTanzaniaThailandTimor-LesteTogoTrinidad and TobagoTunisiaTurkeyTurkmenistanUgandaUkraineUnited Arab EmiratesUnited KingdomUnited StatesUpper middle incomeUruguayUzbekistanVanuatuVenezuela, RBVietnamWest Bank and GazaWorldZambiaZimbabwe Timeline:
This timeline shows a graph from 1962 to 2016 of Portugal. No data until 1961. Number of actual observations by date: 55.
Source name:
World Development Indicators
Source organization:
World Bank national accounts data, and OECD National Accounts data files.
Categories, topics:
Economy & Growth
Last updated:
apr 23, 2017
Indicators value changes by year
Minimum:
-6.367
jan 1, 1976
At the date of observation
Value
Absolute change
Change from previous value
jan 1, 1962
5.417
+5.417
0.0%
jan 1, 1963
6.485
+1.069
19.73%
jan 1, 1964
5.996
-0.489
-7.54%
jan 1, 1965
7.06
+1.064
17.74%
jan 1, 1966
7.592
+0.532
7.53%
jan 1, 1967
3.645
-3.946
-51.98%
jan 1, 1968
7.773
+4.128
113.24%
jan 1, 1969
8.828
+1.055
13.57%
jan 1, 1970
2.335
-6.493
-73.55%
jan 1, 1971
14.87
+12.536
536.86%
jan 1, 1972
5.816
-9.054
-60.89%
jan 1, 1973
8.138
+2.322
39.92%
jan 1, 1974
12.206
+4.068
49.98%
jan 1, 1975
1.555
-10.651
-87.26%
jan 1, 1976
-6.367
-7.922
-509.47%
jan 1, 1977
5.534
+11.901
-186.91%
jan 1, 1978
5.38
-0.154
-2.77%
jan 1, 1979
2.161
-3.219
-59.84%
jan 1, 1980
5.466
+3.305
152.97%
jan 1, 1981
4.321
-1.145
-20.94%
jan 1, 1982
0.352
-3.969
-91.85%
jan 1, 1983
0.669
+0.316
89.81%
jan 1, 1984
0.122
-0.547
-81.77%
jan 1, 1985
-2.704
-2.826
-2.32K%
jan 1, 1986
3.483
+6.187
-228.82%
jan 1, 1987
5.908
+2.425
69.63%
jan 1, 1988
7.349
+1.441
24.39%
jan 1, 1989
8.245
+0.896
12.19%
jan 1, 1990
6.912
-1.333
-16.16%
jan 1, 1991
4.601
-2.312
-33.44%
jan 1, 1992
4.582
-0.019
-0.42%
jan 1, 1993
1.552
-3.03
-66.13%
jan 1, 1994
-1.963
-3.515
-226.49%
jan 1, 1995
0.677
+2.639
-134.47%
jan 1, 1996
4.91
+4.233
625.61%
jan 1, 1997
3.063
-1.847
-37.61%
jan 1, 1998
3.673
+0.61
19.93%
jan 1, 1999
4.629
+0.956
26.01%
jan 1, 2000
3.898
-0.731
-15.8%
jan 1, 2001
2.371
-1.527
-39.17%
jan 1, 2002
1.831
-0.54
-22.76%
jan 1, 2003
1.011
-0.82
-44.78%
jan 1, 2004
-0.446
-1.457
-144.1%
jan 1, 2005
1.565
+2.011
-450.95%
jan 1, 2006
0.728
-0.837
-53.47%
jan 1, 2007
-0.123
-0.851
-116.87%
jan 1, 2008
2.472
+2.595
-2.11K%
jan 1, 2009
-0.487
-2.959
-119.71%
jan 1, 2010
-2.827
-2.339
480.14%
jan 1, 2011
2.238
+5.065
-179.18%
jan 1, 2012
-0.35
-2.588
-115.63%
jan 1, 2013
-4.519
-4.169
1.19K%
jan 1, 2014
-0.055
+4.463
-98.77%
jan 1, 2015
0.591
+0.647
-1.17K%
jan 1, 2016
0.911
+0.319
54.01%
Ranking of countries by current statistics by years


Comments: