29
/
en
AIzaSyAYiBZKx7MnpbEhh9jyipgxe19OcubqV5w
April 1, 2024
239308
Sierra Leone
SLE
true
2
1
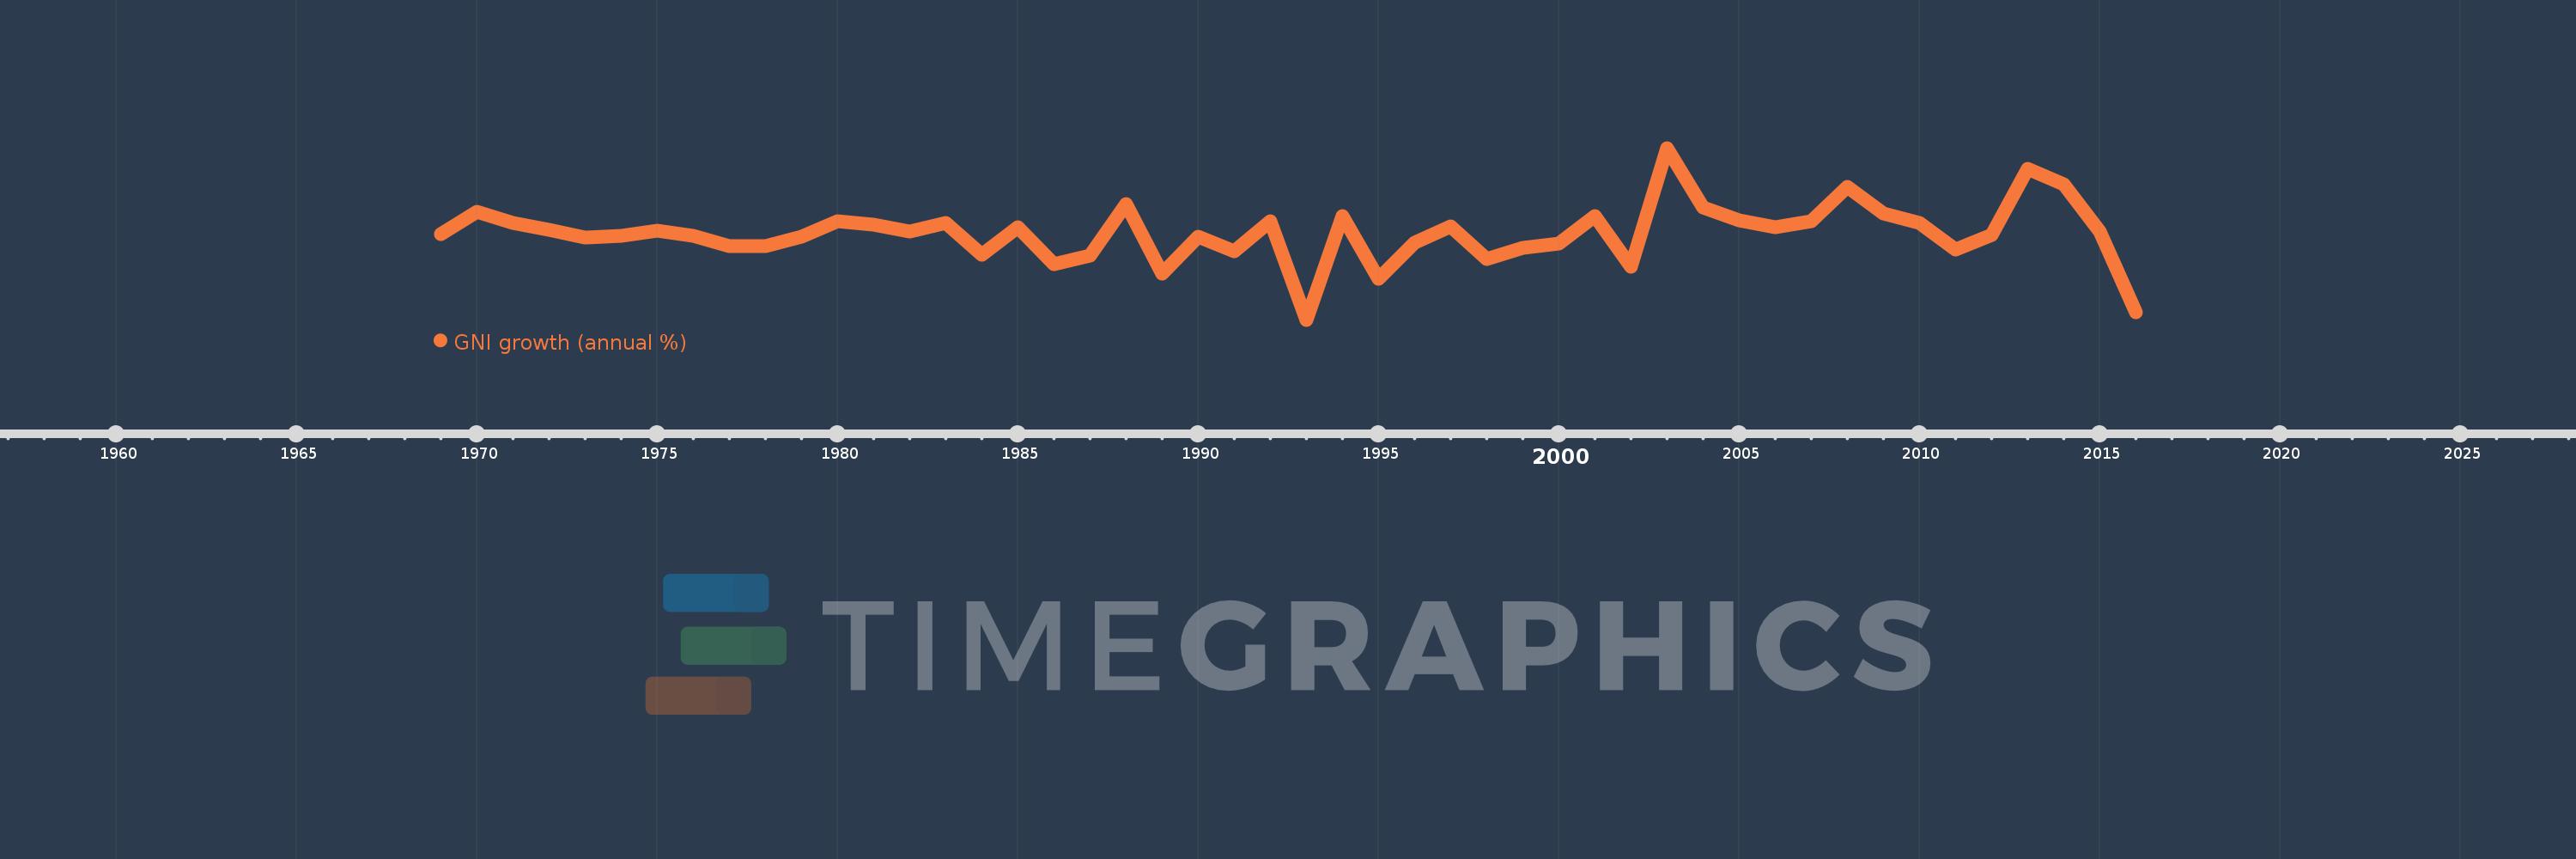
GNI growth (annual %)
2016,2015,2014,2013,2012,2011,2010,2009,2008,2007,2006,2005,2004,2003,2002,2001,2000,1999,1998,1997,1996,1995,1994,1993,1992,1991,1990,1989,1988,1987,1986,1985,1984,1983,1982,1981,1980,1979,1978,1977,1976,1975,1974,1973,1972,1971,1970,1969
This statistics in other country:
AlbaniaAlgeriaAngolaAntigua and BarbudaArab WorldArgentinaArmeniaAustraliaAustriaAzerbaijanBahamas, TheBahrainBangladeshBarbadosBelarusBelgiumBelizeBeninBhutanBoliviaBosnia and HerzegovinaBotswanaBrazilBrunei DarussalamBulgariaBurkina FasoBurundiCabo VerdeCambodiaCameroonCanadaCaribbean small statesCentral Europe and the BalticsChadChileChinaColombiaComorosCongo, Dem. Rep.Congo, Rep.Costa RicaCote d'IvoireCroatiaCubaCyprusCzech RepublicDenmarkDjiboutiDominican RepublicEarly-demographic dividendEast Asia & PacificEast Asia & Pacific (excluding high income)East Asia & Pacific (IDA & IBRD countries)EcuadorEgypt, Arab Rep.El SalvadorEquatorial GuineaEritreaEstoniaEthiopiaEuro areaEurope & Central AsiaEurope & Central Asia (excluding high income)Europe & Central Asia (IDA & IBRD countries)European UnionFijiFinlandFranceGabonGambia, TheGeorgiaGermanyGhanaGreeceGuatemalaGuineaGuinea-BissauHaitiHeavily indebted poor countries (HIPC)High incomeHondurasHong Kong SAR, ChinaHungaryIBRD onlyIcelandIDA & IBRD totalIDA blendIDA onlyIDA totalIndiaIndonesiaIran, Islamic Rep.IrelandIsraelItalyJamaicaJapanJordanKazakhstanKenyaKorea, Rep.KosovoKuwaitKyrgyz RepublicLao PDRLate-demographic dividendLatin America & Caribbean Latin America & Caribbean (excluding high income)Latin America & the Caribbean (IDA & IBRD countries)LatviaLeast developed countries: UN classificationLebanonLiberiaLibyaLithuaniaLow & middle incomeLow incomeLower middle incomeLuxembourgMacao SAR, ChinaMacedonia, FYRMadagascarMalawiMalaysiaMaliMaltaMauritaniaMauritiusMexicoMiddle East & North AfricaMiddle East & North Africa (excluding high income)Middle East & North Africa (IDA & IBRD countries)Middle incomeMoldovaMongoliaMontenegroMoroccoMozambiqueMyanmarNamibiaNepalNetherlandsNew ZealandNicaraguaNigerNigeriaNorth AmericaNorwayOECD membersOmanOther small statesPakistanPanamaPapua New GuineaParaguayPeruPhilippinesPolandPortugalPost-demographic dividendPre-demographic dividendPuerto RicoQatarRomaniaRussian FederationRwandaSamoaSaudi ArabiaSenegalSerbiaSeychellesSierra LeoneSingaporeSlovak RepublicSloveniaSmall statesSomaliaSouth AfricaSouth AsiaSouth Asia (IDA & IBRD)South SudanSpainSri LankaSub-Saharan Africa Sub-Saharan Africa (excluding high income)Sub-Saharan Africa (IDA & IBRD countries)SudanSurinameSwazilandSwedenSwitzerlandSyrian Arab RepublicTajikistanTanzaniaThailandTimor-LesteTogoTrinidad and TobagoTunisiaTurkeyTurkmenistanUgandaUkraineUnited Arab EmiratesUnited KingdomUnited StatesUpper middle incomeUruguayUzbekistanVanuatuVenezuela, RBVietnamWest Bank and GazaWorldZambiaZimbabwe Timeline:
This timeline shows a graph from 1969 to 2016 of Sierra Leone. No data until 1968. Number of actual observations by date: 48.
Source name:
World Development Indicators
Source organization:
World Bank national accounts data, and OECD National Accounts data files.
Categories, topics:
Economy & Growth
Last updated:
apr 23, 2017
Indicators value changes by year
Minimum:
-21.589
jan 1, 1993
Maximum:
26.474
jan 1, 2003
At the date of observation
Value
Absolute change
Change from previous value
jan 1, 1969
2.328
+2.328
0.0%
jan 1, 1970
8.669
+6.341
272.41%
jan 1, 1971
5.422
-3.247
-37.46%
jan 1, 1972
3.513
-1.909
-35.21%
jan 1, 1973
1.388
-2.125
-60.48%
jan 1, 1974
1.999
+0.611
43.98%
jan 1, 1975
3.291
+1.292
64.66%
jan 1, 1976
2.003
-1.288
-39.14%
jan 1, 1977
-0.959
-2.962
-147.86%
jan 1, 1978
-1.017
-0.059
6.13%
jan 1, 1979
1.532
+2.55
-250.63%
jan 1, 1980
5.864
+4.332
282.68%
jan 1, 1981
5.101
-0.763
-13.01%
jan 1, 1982
3.194
-1.907
-37.39%
jan 1, 1983
5.413
+2.219
69.49%
jan 1, 1984
-3.307
-8.721
-161.1%
jan 1, 1985
4.387
+7.695
-232.65%
jan 1, 1986
-5.922
-10.309
-234.98%
jan 1, 1987
-3.558
+2.363
-39.91%
jan 1, 1988
10.729
+14.288
-401.51%
jan 1, 1989
-8.679
-19.409
-180.89%
jan 1, 1990
1.563
+10.242
-118.01%
jan 1, 1991
-2.455
-4.018
-257.07%
jan 1, 1992
5.861
+8.316
-338.71%
jan 1, 1993
-21.589
-27.45
-468.36%
jan 1, 1994
7.443
+29.033
-134.48%
jan 1, 1995
-10.167
-17.61
-236.6%
jan 1, 1996
-0.04
+10.127
-99.61%
jan 1, 1997
4.589
+4.629
-11.54K%
jan 1, 1998
-4.554
-9.144
-199.24%
jan 1, 1999
-1.464
+3.09
-67.85%
jan 1, 2000
-0.359
+1.106
-75.5%
jan 1, 2001
7.528
+7.887
-2.2K%
jan 1, 2002
-6.852
-14.38
-191.02%
jan 1, 2003
26.474
+33.326
-486.34%
jan 1, 2004
9.878
-16.595
-62.69%
jan 1, 2005
6.101
-3.777
-38.24%
jan 1, 2006
4.225
-1.877
-30.76%
jan 1, 2007
5.896
+1.672
39.57%
jan 1, 2008
15.54
+9.644
163.57%
jan 1, 2009
8.229
-7.311
-47.05%
jan 1, 2010
5.578
-2.651
-32.22%
jan 1, 2011
-1.88
-7.458
-133.69%
jan 1, 2012
2.186
+4.065
-216.3%
jan 1, 2013
20.693
+18.507
846.64%
jan 1, 2014
16.247
-4.446
-21.49%
jan 1, 2015
2.985
-13.262
-81.63%
jan 1, 2016
-19.406
-22.391
-750.21%
Ranking of countries by current statistics by years


Comments: