29
/
en
AIzaSyAYiBZKx7MnpbEhh9jyipgxe19OcubqV5w
April 1, 2024
104893
Chile
CHL
true
2
1
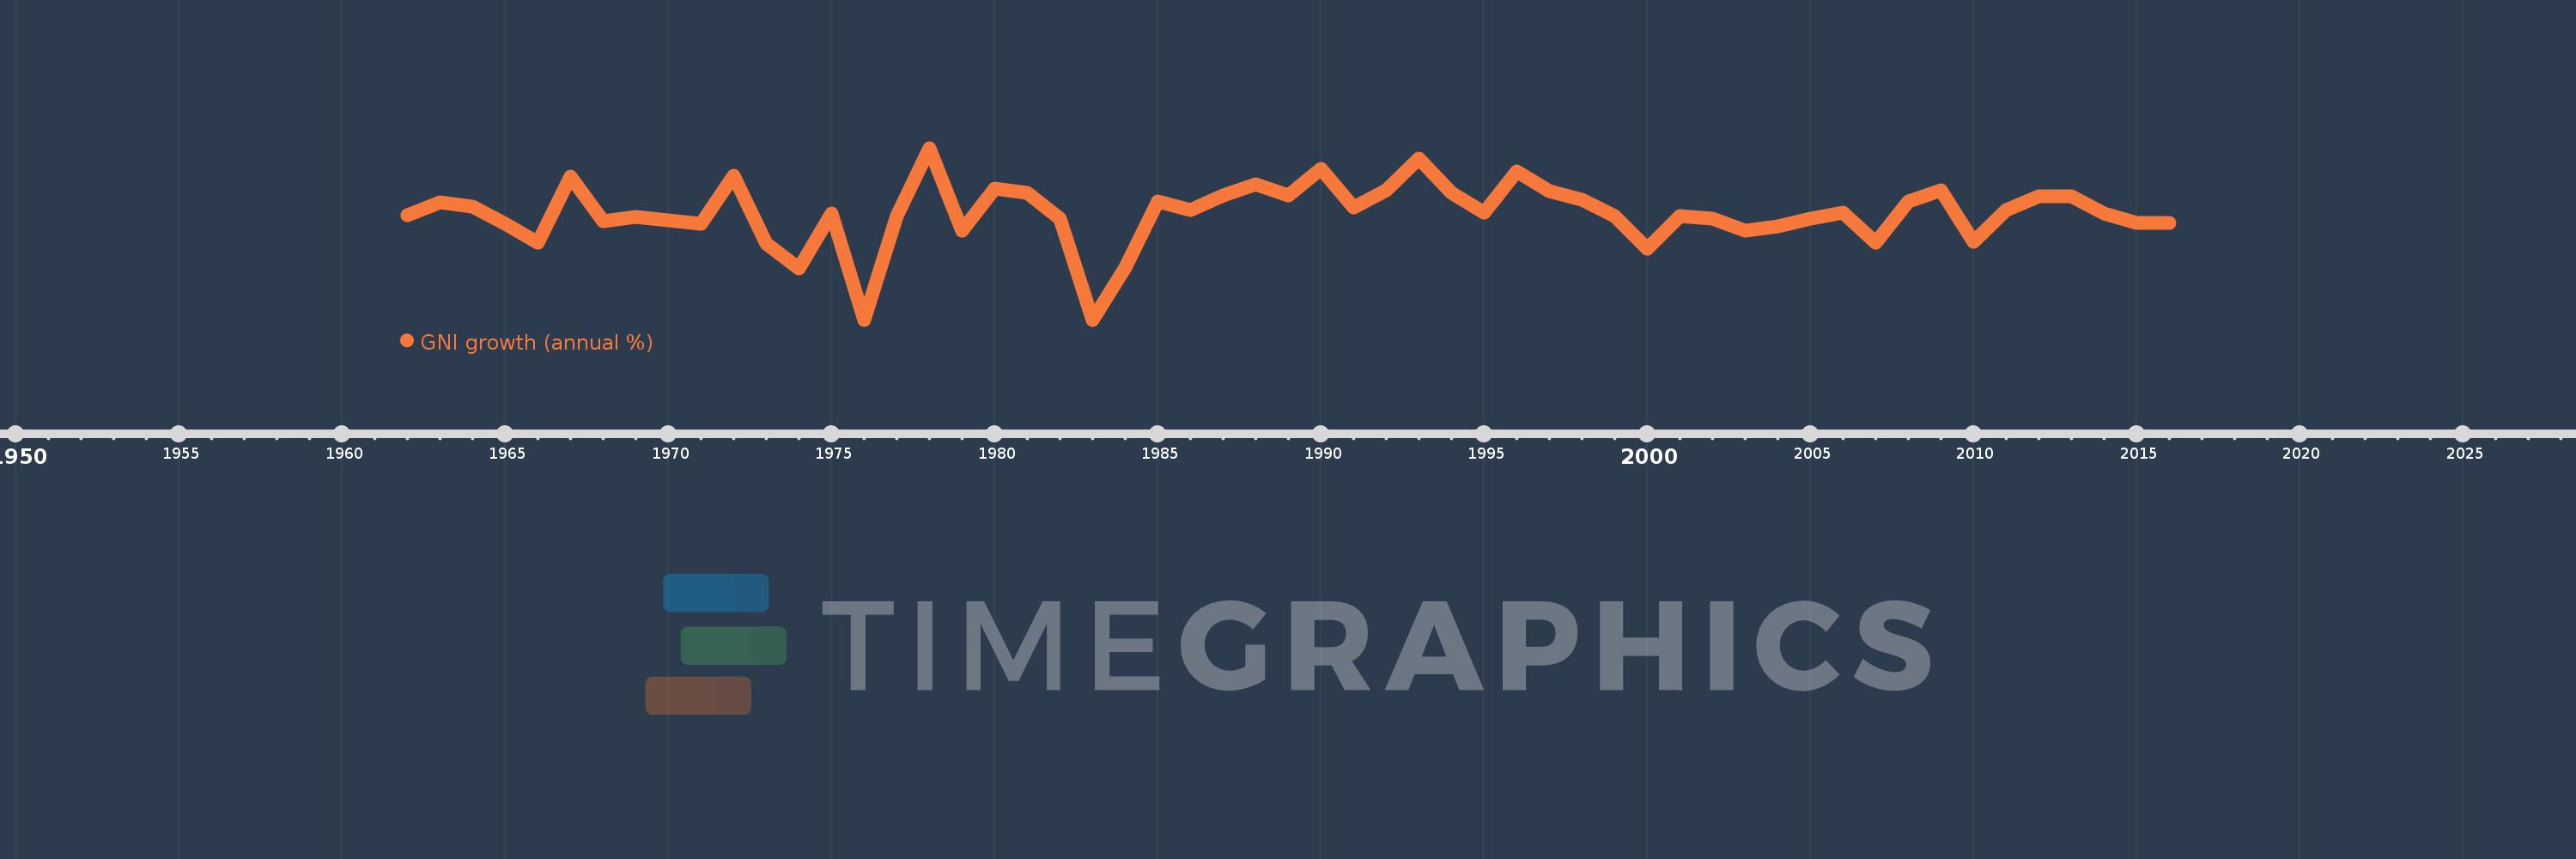
GNI growth (annual %)
2016,2015,2014,2013,2012,2011,2010,2009,2008,2007,2006,2005,2004,2003,2002,2001,2000,1999,1998,1997,1996,1995,1994,1993,1992,1991,1990,1989,1988,1987,1986,1985,1984,1983,1982,1981,1980,1979,1978,1977,1976,1975,1974,1973,1972,1971,1970,1969,1968,1967,1966,1965,1964,1963,1962
This statistics in other country:
AlbaniaAlgeriaAngolaAntigua and BarbudaArab WorldArgentinaArmeniaAustraliaAustriaAzerbaijanBahamas, TheBahrainBangladeshBarbadosBelarusBelgiumBelizeBeninBhutanBoliviaBosnia and HerzegovinaBotswanaBrazilBrunei DarussalamBulgariaBurkina FasoBurundiCabo VerdeCambodiaCameroonCanadaCaribbean small statesCentral Europe and the BalticsChadChileChinaColombiaComorosCongo, Dem. Rep.Congo, Rep.Costa RicaCote d'IvoireCroatiaCubaCyprusCzech RepublicDenmarkDjiboutiDominican RepublicEarly-demographic dividendEast Asia & PacificEast Asia & Pacific (excluding high income)East Asia & Pacific (IDA & IBRD countries)EcuadorEgypt, Arab Rep.El SalvadorEquatorial GuineaEritreaEstoniaEthiopiaEuro areaEurope & Central AsiaEurope & Central Asia (excluding high income)Europe & Central Asia (IDA & IBRD countries)European UnionFijiFinlandFranceGabonGambia, TheGeorgiaGermanyGhanaGreeceGuatemalaGuineaGuinea-BissauHaitiHeavily indebted poor countries (HIPC)High incomeHondurasHong Kong SAR, ChinaHungaryIBRD onlyIcelandIDA & IBRD totalIDA blendIDA onlyIDA totalIndiaIndonesiaIran, Islamic Rep.IrelandIsraelItalyJamaicaJapanJordanKazakhstanKenyaKorea, Rep.KosovoKuwaitKyrgyz RepublicLao PDRLate-demographic dividendLatin America & Caribbean Latin America & Caribbean (excluding high income)Latin America & the Caribbean (IDA & IBRD countries)LatviaLeast developed countries: UN classificationLebanonLiberiaLibyaLithuaniaLow & middle incomeLow incomeLower middle incomeLuxembourgMacao SAR, ChinaMacedonia, FYRMadagascarMalawiMalaysiaMaliMaltaMauritaniaMauritiusMexicoMiddle East & North AfricaMiddle East & North Africa (excluding high income)Middle East & North Africa (IDA & IBRD countries)Middle incomeMoldovaMongoliaMontenegroMoroccoMozambiqueMyanmarNamibiaNepalNetherlandsNew ZealandNicaraguaNigerNigeriaNorth AmericaNorwayOECD membersOmanOther small statesPakistanPanamaPapua New GuineaParaguayPeruPhilippinesPolandPortugalPost-demographic dividendPre-demographic dividendPuerto RicoQatarRomaniaRussian FederationRwandaSamoaSaudi ArabiaSenegalSerbiaSeychellesSierra LeoneSingaporeSlovak RepublicSloveniaSmall statesSomaliaSouth AfricaSouth AsiaSouth Asia (IDA & IBRD)South SudanSpainSri LankaSub-Saharan Africa Sub-Saharan Africa (excluding high income)Sub-Saharan Africa (IDA & IBRD countries)SudanSurinameSwazilandSwedenSwitzerlandSyrian Arab RepublicTajikistanTanzaniaThailandTimor-LesteTogoTrinidad and TobagoTunisiaTurkeyTurkmenistanUgandaUkraineUnited Arab EmiratesUnited KingdomUnited StatesUpper middle incomeUruguayUzbekistanVanuatuVenezuela, RBVietnamWest Bank and GazaWorldZambiaZimbabwe Timeline:
This timeline shows a graph from 1962 to 2016 of Chile. No data until 1961. Number of actual observations by date: 55.
Source name:
World Development Indicators
Source organization:
World Bank national accounts data, and OECD National Accounts data files.
Categories, topics:
Economy & Growth
Last updated:
apr 23, 2017
Indicators value changes by year
Minimum:
-13.185
jan 1, 1976
Maximum:
15.261
jan 1, 1978
At the date of observation
Value
Absolute change
Change from previous value
jan 1, 1962
4.178
+4.178
0.0%
jan 1, 1963
6.283
+2.105
50.39%
jan 1, 1964
5.508
-0.775
-12.33%
jan 1, 1965
2.765
-2.743
-49.81%
jan 1, 1966
-0.471
-3.236
-117.03%
jan 1, 1967
10.473
+10.943
-2.32K%
jan 1, 1968
3.065
-7.408
-70.73%
jan 1, 1969
3.911
+0.846
27.59%
jan 1, 1970
3.275
-0.635
-16.24%
jan 1, 1971
2.754
-0.521
-15.91%
jan 1, 1972
10.668
+7.914
287.33%
jan 1, 1973
-0.513
-11.181
-104.81%
jan 1, 1974
-4.709
-4.196
817.89%
jan 1, 1975
4.376
+9.085
-192.93%
jan 1, 1976
-13.185
-17.561
-401.29%
jan 1, 1977
4.022
+17.207
-130.51%
jan 1, 1978
15.261
+11.239
279.41%
jan 1, 1979
1.501
-13.76
-90.16%
jan 1, 1980
8.554
+7.053
469.8%
jan 1, 1981
7.765
-0.788
-9.22%
jan 1, 1982
3.601
-4.165
-53.63%
jan 1, 1983
-13.177
-16.778
-465.96%
jan 1, 1984
-4.619
+8.558
-64.95%
jan 1, 1985
6.45
+11.069
-239.64%
jan 1, 1986
4.999
-1.451
-22.5%
jan 1, 1987
7.46
+2.461
49.22%
jan 1, 1988
9.206
+1.746
23.4%
jan 1, 1989
7.342
-1.863
-20.24%
jan 1, 1990
11.854
+4.512
61.45%
jan 1, 1991
5.336
-6.518
-54.99%
jan 1, 1992
8.186
+2.85
53.41%
jan 1, 1993
13.515
+5.329
65.11%
jan 1, 1994
7.769
-5.746
-42.52%
jan 1, 1995
4.572
-3.197
-41.15%
jan 1, 1996
11.364
+6.792
148.56%
jan 1, 1997
8.074
-3.29
-28.96%
jan 1, 1998
6.742
-1.332
-16.5%
jan 1, 1999
4.013
-2.728
-40.47%
jan 1, 2000
-1.363
-5.377
-133.96%
jan 1, 2001
3.96
+5.323
-390.49%
jan 1, 2002
3.565
-0.395
-9.97%
jan 1, 2003
1.614
-1.951
-54.73%
jan 1, 2004
2.22
+0.606
37.57%
jan 1, 2005
3.548
+1.328
59.8%
jan 1, 2006
4.585
+1.037
29.22%
jan 1, 2007
-0.458
-5.043
-110.0%
jan 1, 2008
6.421
+6.879
-1.5K%
jan 1, 2009
8.266
+1.845
28.73%
jan 1, 2010
-0.349
-8.615
-104.22%
jan 1, 2011
4.946
+5.295
-1.52K%
jan 1, 2012
7.264
+2.318
46.86%
jan 1, 2013
7.235
-0.028
-0.39%
jan 1, 2014
4.476
-2.76
-38.14%
jan 1, 2015
2.812
-1.664
-37.17%
jan 1, 2016
2.774
-0.038
-1.35%
Ranking of countries by current statistics by years


Comments: