29
/
en
AIzaSyAYiBZKx7MnpbEhh9jyipgxe19OcubqV5w
April 1, 2024
207960
Netherlands
NLD
true
2
1
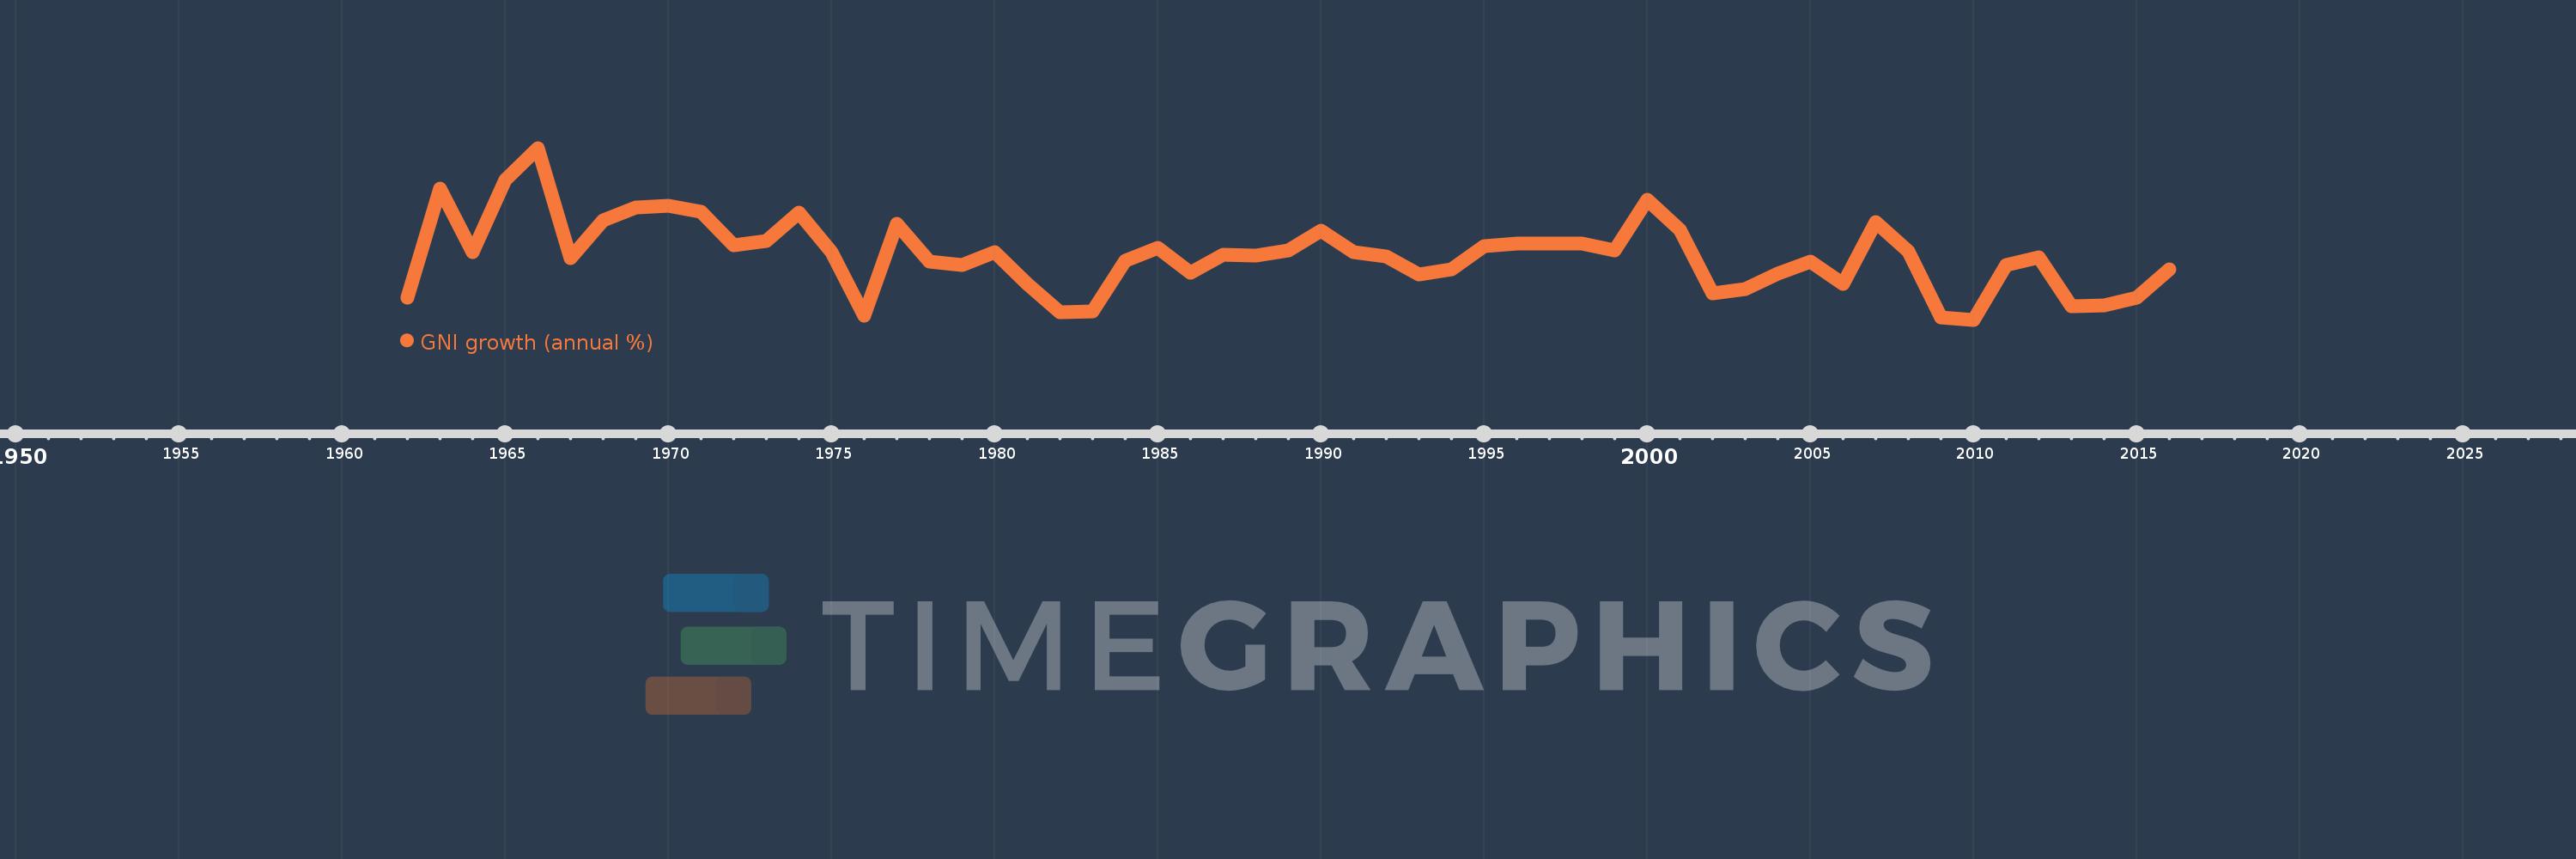
GNI growth (annual %)
2016,2015,2014,2013,2012,2011,2010,2009,2008,2007,2006,2005,2004,2003,2002,2001,2000,1999,1998,1997,1996,1995,1994,1993,1992,1991,1990,1989,1988,1987,1986,1985,1984,1983,1982,1981,1980,1979,1978,1977,1976,1975,1974,1973,1972,1971,1970,1969,1968,1967,1966,1965,1964,1963,1962
This statistics in other country:
AlbaniaAlgeriaAngolaAntigua and BarbudaArab WorldArgentinaArmeniaAustraliaAustriaAzerbaijanBahamas, TheBahrainBangladeshBarbadosBelarusBelgiumBelizeBeninBhutanBoliviaBosnia and HerzegovinaBotswanaBrazilBrunei DarussalamBulgariaBurkina FasoBurundiCabo VerdeCambodiaCameroonCanadaCaribbean small statesCentral Europe and the BalticsChadChileChinaColombiaComorosCongo, Dem. Rep.Congo, Rep.Costa RicaCote d'IvoireCroatiaCubaCyprusCzech RepublicDenmarkDjiboutiDominican RepublicEarly-demographic dividendEast Asia & PacificEast Asia & Pacific (excluding high income)East Asia & Pacific (IDA & IBRD countries)EcuadorEgypt, Arab Rep.El SalvadorEquatorial GuineaEritreaEstoniaEthiopiaEuro areaEurope & Central AsiaEurope & Central Asia (excluding high income)Europe & Central Asia (IDA & IBRD countries)European UnionFijiFinlandFranceGabonGambia, TheGeorgiaGermanyGhanaGreeceGuatemalaGuineaGuinea-BissauHaitiHeavily indebted poor countries (HIPC)High incomeHondurasHong Kong SAR, ChinaHungaryIBRD onlyIcelandIDA & IBRD totalIDA blendIDA onlyIDA totalIndiaIndonesiaIran, Islamic Rep.IrelandIsraelItalyJamaicaJapanJordanKazakhstanKenyaKorea, Rep.KosovoKuwaitKyrgyz RepublicLao PDRLate-demographic dividendLatin America & Caribbean Latin America & Caribbean (excluding high income)Latin America & the Caribbean (IDA & IBRD countries)LatviaLeast developed countries: UN classificationLebanonLiberiaLibyaLithuaniaLow & middle incomeLow incomeLower middle incomeLuxembourgMacao SAR, ChinaMacedonia, FYRMadagascarMalawiMalaysiaMaliMaltaMauritaniaMauritiusMexicoMiddle East & North AfricaMiddle East & North Africa (excluding high income)Middle East & North Africa (IDA & IBRD countries)Middle incomeMoldovaMongoliaMontenegroMoroccoMozambiqueMyanmarNamibiaNepalNetherlandsNew ZealandNicaraguaNigerNigeriaNorth AmericaNorwayOECD membersOmanOther small statesPakistanPanamaPapua New GuineaParaguayPeruPhilippinesPolandPortugalPost-demographic dividendPre-demographic dividendPuerto RicoQatarRomaniaRussian FederationRwandaSamoaSaudi ArabiaSenegalSerbiaSeychellesSierra LeoneSingaporeSlovak RepublicSloveniaSmall statesSomaliaSouth AfricaSouth AsiaSouth Asia (IDA & IBRD)South SudanSpainSri LankaSub-Saharan Africa Sub-Saharan Africa (excluding high income)Sub-Saharan Africa (IDA & IBRD countries)SudanSurinameSwazilandSwedenSwitzerlandSyrian Arab RepublicTajikistanTanzaniaThailandTimor-LesteTogoTrinidad and TobagoTunisiaTurkeyTurkmenistanUgandaUkraineUnited Arab EmiratesUnited KingdomUnited StatesUpper middle incomeUruguayUzbekistanVanuatuVenezuela, RBVietnamWest Bank and GazaWorldZambiaZimbabwe Timeline:
This timeline shows a graph from 1962 to 2016 of Netherlands. No data until 1961. Number of actual observations by date: 55.
Source name:
World Development Indicators
Source organization:
World Bank national accounts data, and OECD National Accounts data files.
Categories, topics:
Economy & Growth
Last updated:
apr 23, 2017
Indicators value changes by year
Minimum:
-1.848
jan 1, 2010
Maximum:
10.651
jan 1, 1966
At the date of observation
Value
Absolute change
Change from previous value
jan 1, 1962
-0.249
-0.249
0.0%
jan 1, 1963
7.694
+7.943
-3.19K%
jan 1, 1964
3.088
-4.606
-59.87%
jan 1, 1965
8.316
+5.229
169.35%
jan 1, 1966
10.651
+2.335
28.07%
jan 1, 1967
2.646
-8.005
-75.16%
jan 1, 1968
5.36
+2.714
102.55%
jan 1, 1969
6.315
+0.955
17.82%
jan 1, 1970
6.456
+0.142
2.25%
jan 1, 1971
6.033
-0.423
-6.55%
jan 1, 1972
3.552
-2.481
-41.13%
jan 1, 1973
3.883
+0.331
9.33%
jan 1, 1974
5.915
+2.031
52.31%
jan 1, 1975
3.04
-2.874
-48.59%
jan 1, 1976
-1.55
-4.59
-150.97%
jan 1, 1977
5.157
+6.706
-432.74%
jan 1, 1978
2.353
-2.804
-54.37%
jan 1, 1979
2.156
-0.196
-8.35%
jan 1, 1980
3.092
+0.936
43.4%
jan 1, 1981
0.755
-2.338
-75.59%
jan 1, 1982
-1.302
-2.057
-272.56%
jan 1, 1983
-1.248
+0.054
-4.15%
jan 1, 1984
2.438
+3.686
-295.33%
jan 1, 1985
3.364
+0.926
37.97%
jan 1, 1986
1.545
-1.819
-54.08%
jan 1, 1987
2.867
+1.323
85.62%
jan 1, 1988
2.833
-0.035
-1.22%
jan 1, 1989
3.17
+0.338
11.92%
jan 1, 1990
4.657
+1.487
46.9%
jan 1, 1991
3.075
-1.581
-33.96%
jan 1, 1992
2.76
-0.315
-10.25%
jan 1, 1993
1.422
-1.338
-48.47%
jan 1, 1994
1.81
+0.387
27.23%
jan 1, 1995
3.479
+1.669
92.24%
jan 1, 1996
3.723
+0.244
7.03%
jan 1, 1997
3.697
-0.027
-0.71%
jan 1, 1998
3.702
+0.005
0.14%
jan 1, 1999
3.214
-0.488
-13.18%
jan 1, 2000
6.857
+3.643
113.36%
jan 1, 2001
4.682
-2.175
-31.72%
jan 1, 2002
0.08
-4.602
-98.3%
jan 1, 2003
0.352
+0.273
342.58%
jan 1, 2004
1.535
+1.183
335.64%
jan 1, 2005
2.389
+0.854
55.61%
jan 1, 2006
0.782
-1.607
-67.25%
jan 1, 2007
5.246
+4.463
570.46%
jan 1, 2008
3.141
-2.104
-40.12%
jan 1, 2009
-1.699
-4.84
-154.08%
jan 1, 2010
-1.848
-0.149
8.78%
jan 1, 2011
2.132
+3.98
-215.39%
jan 1, 2012
2.679
+0.547
25.63%
jan 1, 2013
-0.837
-3.516
-131.24%
jan 1, 2014
-0.83
+0.007
-0.81%
jan 1, 2015
-0.226
+0.604
-72.75%
jan 1, 2016
1.847
+2.073
-916.4%
Ranking of countries by current statistics by years


Comments: