29
/
en
AIzaSyAYiBZKx7MnpbEhh9jyipgxe19OcubqV5w
April 1, 2024
101108
Canada
CAN
true
2
1
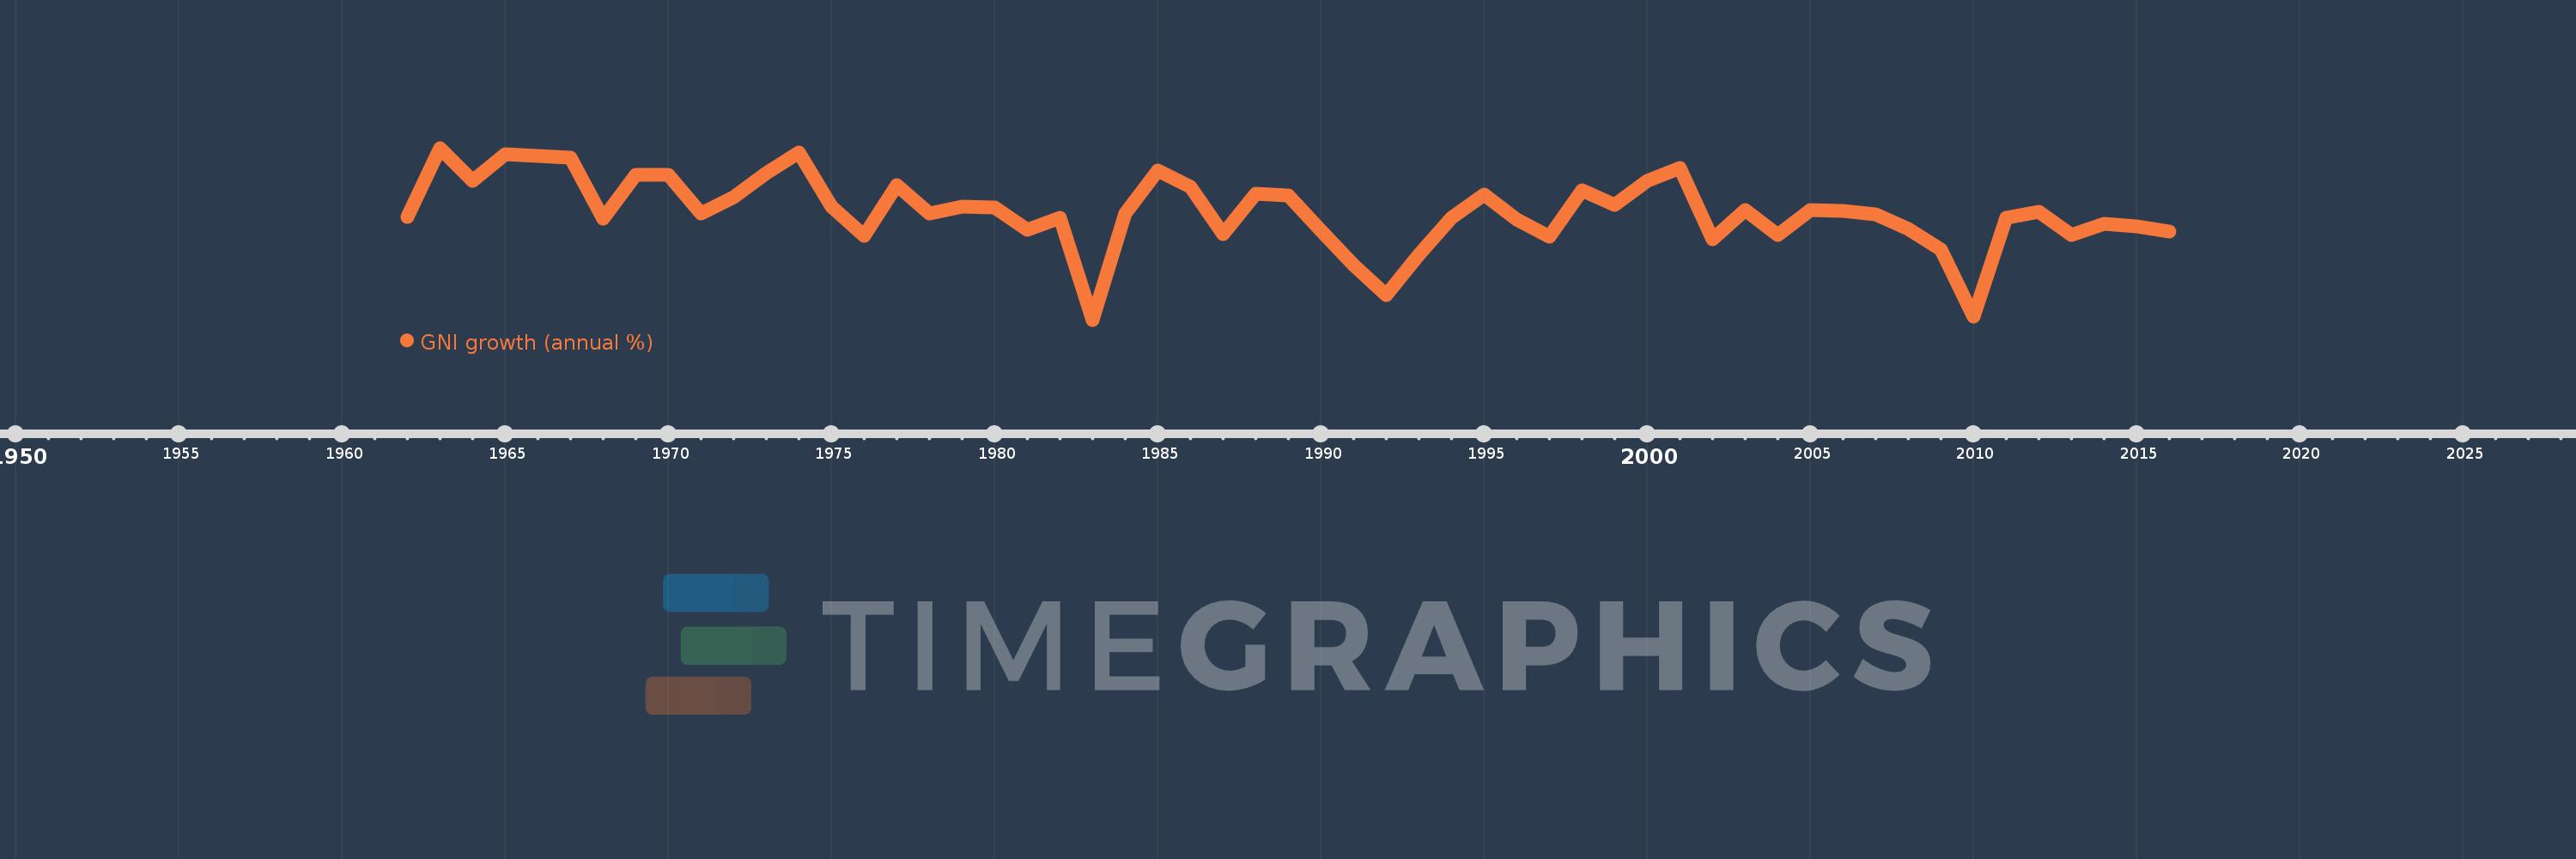
GNI growth (annual %)
2016,2015,2014,2013,2012,2011,2010,2009,2008,2007,2006,2005,2004,2003,2002,2001,2000,1999,1998,1997,1996,1995,1994,1993,1992,1991,1990,1989,1988,1987,1986,1985,1984,1983,1982,1981,1980,1979,1978,1977,1976,1975,1974,1973,1972,1971,1970,1969,1968,1967,1966,1965,1964,1963,1962
This statistics in other country:
AlbaniaAlgeriaAngolaAntigua and BarbudaArab WorldArgentinaArmeniaAustraliaAustriaAzerbaijanBahamas, TheBahrainBangladeshBarbadosBelarusBelgiumBelizeBeninBhutanBoliviaBosnia and HerzegovinaBotswanaBrazilBrunei DarussalamBulgariaBurkina FasoBurundiCabo VerdeCambodiaCameroonCanadaCaribbean small statesCentral Europe and the BalticsChadChileChinaColombiaComorosCongo, Dem. Rep.Congo, Rep.Costa RicaCote d'IvoireCroatiaCubaCyprusCzech RepublicDenmarkDjiboutiDominican RepublicEarly-demographic dividendEast Asia & PacificEast Asia & Pacific (excluding high income)East Asia & Pacific (IDA & IBRD countries)EcuadorEgypt, Arab Rep.El SalvadorEquatorial GuineaEritreaEstoniaEthiopiaEuro areaEurope & Central AsiaEurope & Central Asia (excluding high income)Europe & Central Asia (IDA & IBRD countries)European UnionFijiFinlandFranceGabonGambia, TheGeorgiaGermanyGhanaGreeceGuatemalaGuineaGuinea-BissauHaitiHeavily indebted poor countries (HIPC)High incomeHondurasHong Kong SAR, ChinaHungaryIBRD onlyIcelandIDA & IBRD totalIDA blendIDA onlyIDA totalIndiaIndonesiaIran, Islamic Rep.IrelandIsraelItalyJamaicaJapanJordanKazakhstanKenyaKorea, Rep.KosovoKuwaitKyrgyz RepublicLao PDRLate-demographic dividendLatin America & Caribbean Latin America & Caribbean (excluding high income)Latin America & the Caribbean (IDA & IBRD countries)LatviaLeast developed countries: UN classificationLebanonLiberiaLibyaLithuaniaLow & middle incomeLow incomeLower middle incomeLuxembourgMacao SAR, ChinaMacedonia, FYRMadagascarMalawiMalaysiaMaliMaltaMauritaniaMauritiusMexicoMiddle East & North AfricaMiddle East & North Africa (excluding high income)Middle East & North Africa (IDA & IBRD countries)Middle incomeMoldovaMongoliaMontenegroMoroccoMozambiqueMyanmarNamibiaNepalNetherlandsNew ZealandNicaraguaNigerNigeriaNorth AmericaNorwayOECD membersOmanOther small statesPakistanPanamaPapua New GuineaParaguayPeruPhilippinesPolandPortugalPost-demographic dividendPre-demographic dividendPuerto RicoQatarRomaniaRussian FederationRwandaSamoaSaudi ArabiaSenegalSerbiaSeychellesSierra LeoneSingaporeSlovak RepublicSloveniaSmall statesSomaliaSouth AfricaSouth AsiaSouth Asia (IDA & IBRD)South SudanSpainSri LankaSub-Saharan Africa Sub-Saharan Africa (excluding high income)Sub-Saharan Africa (IDA & IBRD countries)SudanSurinameSwazilandSwedenSwitzerlandSyrian Arab RepublicTajikistanTanzaniaThailandTimor-LesteTogoTrinidad and TobagoTunisiaTurkeyTurkmenistanUgandaUkraineUnited Arab EmiratesUnited KingdomUnited StatesUpper middle incomeUruguayUzbekistanVanuatuVenezuela, RBVietnamWest Bank and GazaWorldZambiaZimbabwe Timeline:
This timeline shows a graph from 1962 to 2016 of Canada. No data until 1961. Number of actual observations by date: 55.
Source name:
World Development Indicators
Source organization:
World Bank national accounts data, and OECD National Accounts data files.
Categories, topics:
Economy & Growth
Last updated:
apr 23, 2017
Indicators value changes by year
Minimum:
-3.346
jan 1, 1983
At the date of observation
Value
Absolute change
Change from previous value
jan 1, 1962
2.951
+2.951
0.0%
jan 1, 1963
7.147
+4.196
142.19%
jan 1, 1964
5.136
-2.012
-28.15%
jan 1, 1965
6.739
+1.604
31.22%
jan 1, 1966
6.658
-0.081
-1.21%
jan 1, 1967
6.572
-0.085
-1.28%
jan 1, 1968
2.854
-3.718
-56.57%
jan 1, 1969
5.49
+2.636
92.37%
jan 1, 1970
5.489
-0.002
-0.03%
jan 1, 1971
3.143
-2.346
-42.74%
jan 1, 1972
4.134
+0.991
31.53%
jan 1, 1973
5.592
+1.458
35.27%
jan 1, 1974
6.884
+1.293
23.11%
jan 1, 1975
3.578
-3.306
-48.02%
jan 1, 1976
1.804
-1.774
-49.58%
jan 1, 1977
4.888
+3.084
170.95%
jan 1, 1978
3.143
-1.745
-35.71%
jan 1, 1979
3.586
+0.443
14.11%
jan 1, 1980
3.535
-0.051
-1.43%
jan 1, 1981
2.155
-1.38
-39.03%
jan 1, 1982
2.858
+0.702
32.58%
jan 1, 1983
-3.346
-6.203
-217.08%
jan 1, 1984
3.159
+6.504
-194.41%
jan 1, 1985
5.762
+2.603
82.41%
jan 1, 1986
4.794
-0.968
-16.79%
jan 1, 1987
1.88
-2.914
-60.78%
jan 1, 1988
4.372
+2.491
132.5%
jan 1, 1989
4.262
-0.109
-2.5%
jan 1, 1990
2.109
-2.153
-50.53%
jan 1, 1991
0.01
-2.099
-99.54%
jan 1, 1992
-1.824
-1.834
-19.01K%
jan 1, 1993
0.627
+2.451
-134.38%
jan 1, 1994
2.868
+2.24
357.26%
jan 1, 1995
4.312
+1.444
50.37%
jan 1, 1996
2.784
-1.528
-35.43%
jan 1, 1997
1.72
-1.065
-38.24%
jan 1, 1998
4.542
+2.822
164.11%
jan 1, 1999
3.66
-0.881
-19.4%
jan 1, 2000
5.146
+1.485
40.58%
jan 1, 2001
5.906
+0.76
14.77%
jan 1, 2002
1.578
-4.327
-73.28%
jan 1, 2003
3.33
+1.752
110.99%
jan 1, 2004
1.838
-1.492
-44.81%
jan 1, 2005
3.371
+1.533
83.43%
jan 1, 2006
3.299
-0.072
-2.15%
jan 1, 2007
3.093
-0.205
-6.22%
jan 1, 2008
2.177
-0.916
-29.62%
jan 1, 2009
0.931
-1.246
-57.25%
jan 1, 2010
-3.145
-4.076
-438.02%
jan 1, 2011
2.871
+6.016
-191.27%
jan 1, 2012
3.241
+0.37
12.88%
jan 1, 2013
1.837
-1.404
-43.32%
jan 1, 2014
2.53
+0.693
37.74%
jan 1, 2015
2.343
-0.187
-7.4%
jan 1, 2016
2.018
-0.325
-13.86%
Ranking of countries by current statistics by years


Comments: