29
/
en
AIzaSyAYiBZKx7MnpbEhh9jyipgxe19OcubqV5w
April 1, 2024
202941
Mozambique
MOZ
true
2
1
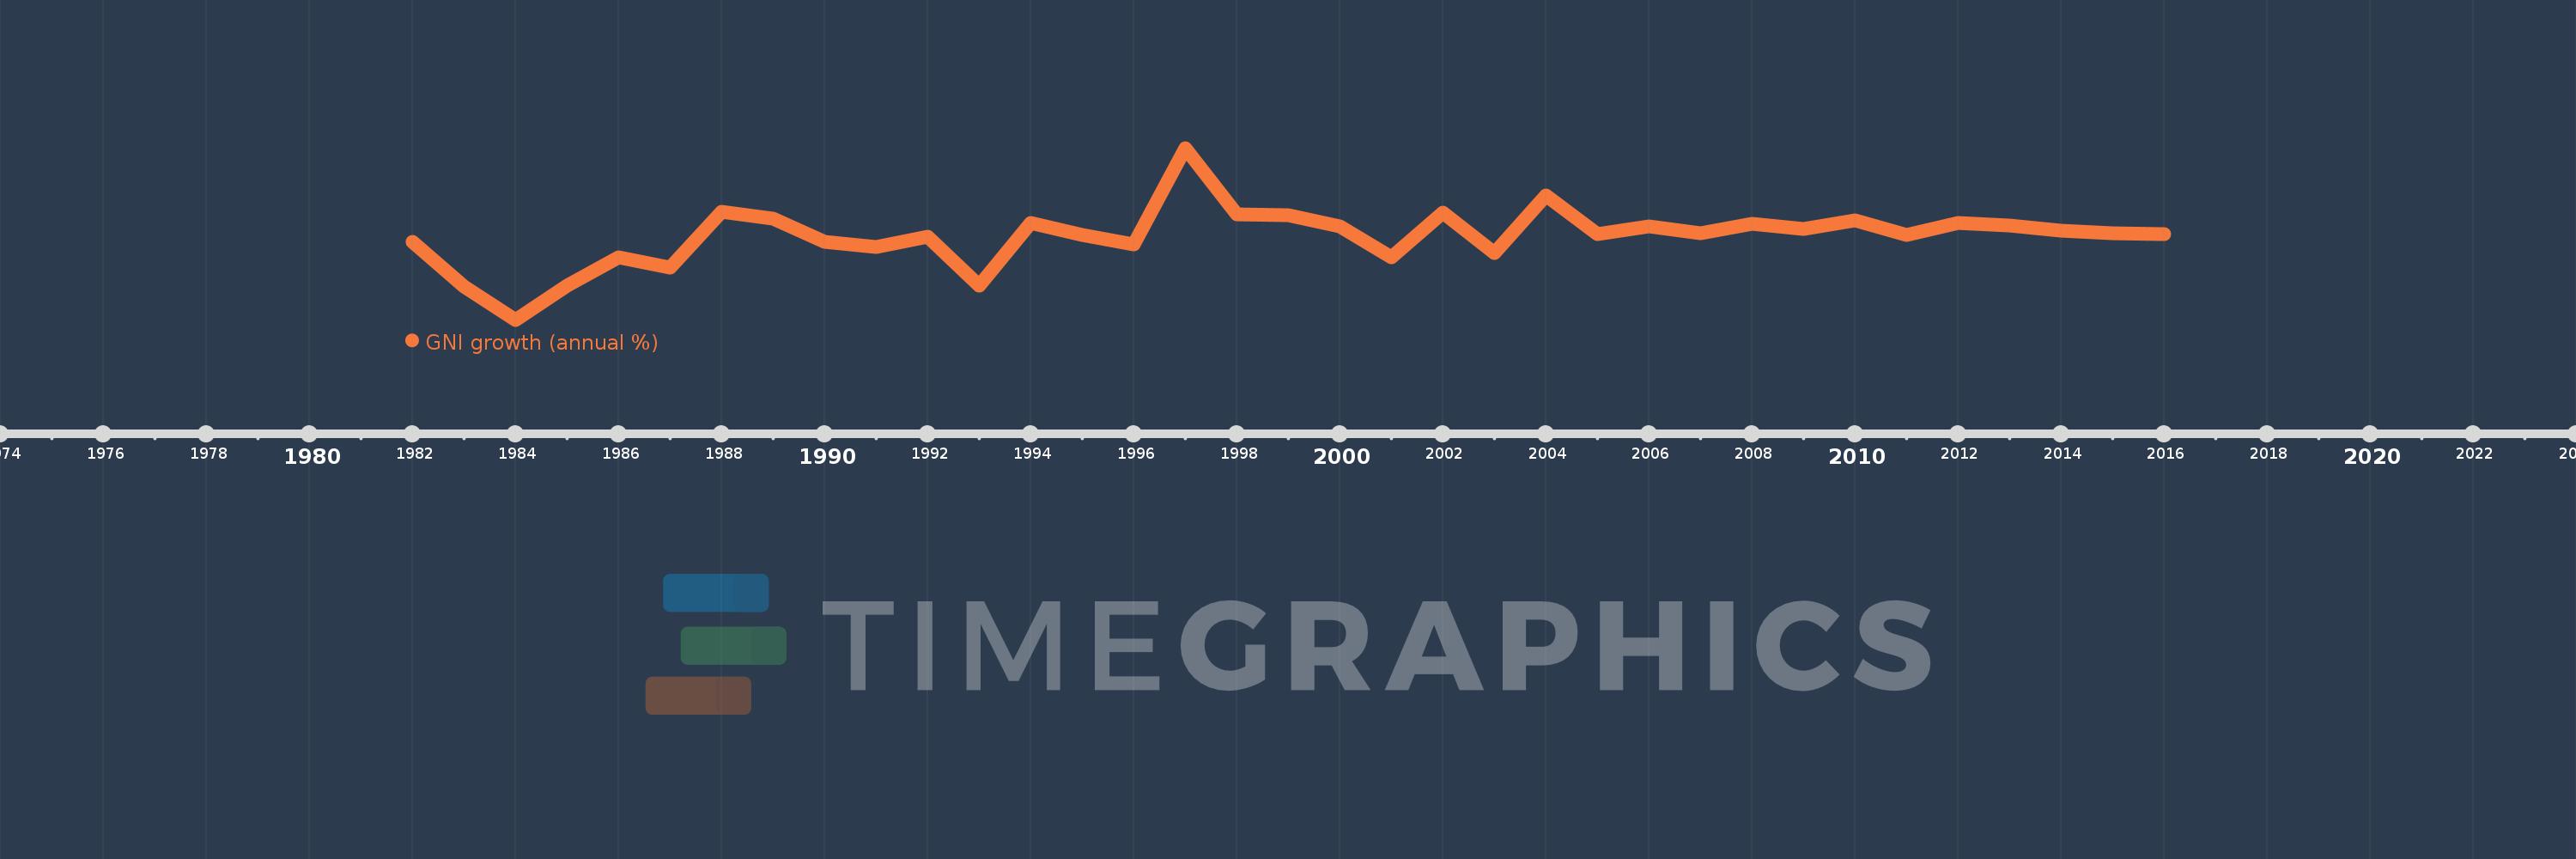
GNI growth (annual %)
2016,2015,2014,2013,2012,2011,2010,2009,2008,2007,2006,2005,2004,2003,2002,2001,2000,1999,1998,1997,1996,1995,1994,1993,1992,1991,1990,1989,1988,1987,1986,1985,1984,1983,1982
This statistics in other country:
AlbaniaAlgeriaAngolaAntigua and BarbudaArab WorldArgentinaArmeniaAustraliaAustriaAzerbaijanBahamas, TheBahrainBangladeshBarbadosBelarusBelgiumBelizeBeninBhutanBoliviaBosnia and HerzegovinaBotswanaBrazilBrunei DarussalamBulgariaBurkina FasoBurundiCabo VerdeCambodiaCameroonCanadaCaribbean small statesCentral Europe and the BalticsChadChileChinaColombiaComorosCongo, Dem. Rep.Congo, Rep.Costa RicaCote d'IvoireCroatiaCubaCyprusCzech RepublicDenmarkDjiboutiDominican RepublicEarly-demographic dividendEast Asia & PacificEast Asia & Pacific (excluding high income)East Asia & Pacific (IDA & IBRD countries)EcuadorEgypt, Arab Rep.El SalvadorEquatorial GuineaEritreaEstoniaEthiopiaEuro areaEurope & Central AsiaEurope & Central Asia (excluding high income)Europe & Central Asia (IDA & IBRD countries)European UnionFijiFinlandFranceGabonGambia, TheGeorgiaGermanyGhanaGreeceGuatemalaGuineaGuinea-BissauHaitiHeavily indebted poor countries (HIPC)High incomeHondurasHong Kong SAR, ChinaHungaryIBRD onlyIcelandIDA & IBRD totalIDA blendIDA onlyIDA totalIndiaIndonesiaIran, Islamic Rep.IrelandIsraelItalyJamaicaJapanJordanKazakhstanKenyaKorea, Rep.KosovoKuwaitKyrgyz RepublicLao PDRLate-demographic dividendLatin America & Caribbean Latin America & Caribbean (excluding high income)Latin America & the Caribbean (IDA & IBRD countries)LatviaLeast developed countries: UN classificationLebanonLiberiaLibyaLithuaniaLow & middle incomeLow incomeLower middle incomeLuxembourgMacao SAR, ChinaMacedonia, FYRMadagascarMalawiMalaysiaMaliMaltaMauritaniaMauritiusMexicoMiddle East & North AfricaMiddle East & North Africa (excluding high income)Middle East & North Africa (IDA & IBRD countries)Middle incomeMoldovaMongoliaMontenegroMoroccoMozambiqueMyanmarNamibiaNepalNetherlandsNew ZealandNicaraguaNigerNigeriaNorth AmericaNorwayOECD membersOmanOther small statesPakistanPanamaPapua New GuineaParaguayPeruPhilippinesPolandPortugalPost-demographic dividendPre-demographic dividendPuerto RicoQatarRomaniaRussian FederationRwandaSamoaSaudi ArabiaSenegalSerbiaSeychellesSierra LeoneSingaporeSlovak RepublicSloveniaSmall statesSomaliaSouth AfricaSouth AsiaSouth Asia (IDA & IBRD)South SudanSpainSri LankaSub-Saharan Africa Sub-Saharan Africa (excluding high income)Sub-Saharan Africa (IDA & IBRD countries)SudanSurinameSwazilandSwedenSwitzerlandSyrian Arab RepublicTajikistanTanzaniaThailandTimor-LesteTogoTrinidad and TobagoTunisiaTurkeyTurkmenistanUgandaUkraineUnited Arab EmiratesUnited KingdomUnited StatesUpper middle incomeUruguayUzbekistanVanuatuVenezuela, RBVietnamWest Bank and GazaWorldZambiaZimbabwe Timeline:
This timeline shows a graph from 1982 to 2016 of Mozambique. No data until 1981. Number of actual observations by date: 35.
Source name:
World Development Indicators
Source organization:
World Bank national accounts data, and OECD National Accounts data files.
Categories, topics:
Economy & Growth
Last updated:
apr 23, 2017
Indicators value changes by year
Minimum:
-16.189
jan 1, 1984
At the date of observation
Value
Absolute change
Change from previous value
jan 1, 1982
4.141
+4.141
0.0%
jan 1, 1983
-7.548
-11.689
-282.26%
jan 1, 1984
-16.189
-8.642
114.49%
jan 1, 1985
-7.242
+8.947
-55.26%
jan 1, 1986
0.217
+7.46
-103.0%
jan 1, 1987
-2.606
-2.823
-1.3K%
jan 1, 1988
12.066
+14.672
-562.97%
jan 1, 1989
10.27
-1.795
-14.88%
jan 1, 1990
4.262
-6.009
-58.5%
jan 1, 1991
2.777
-1.484
-34.83%
jan 1, 1992
5.646
+2.869
103.29%
jan 1, 1993
-7.343
-12.989
-230.05%
jan 1, 1994
9.226
+16.569
-225.64%
jan 1, 1995
6.063
-3.163
-34.29%
jan 1, 1996
3.504
-2.558
-42.2%
jan 1, 1997
28.79
+25.286
721.56%
jan 1, 1998
11.432
-17.358
-60.29%
jan 1, 1999
11.127
-0.305
-2.67%
jan 1, 2000
8.185
-2.942
-26.44%
jan 1, 2001
0.229
-7.956
-97.2%
jan 1, 2002
11.774
+11.545
5.04K%
jan 1, 2003
1.295
-10.479
-89.0%
jan 1, 2004
16.366
+15.071
1.16K%
jan 1, 2005
6.302
-10.064
-61.49%
jan 1, 2006
8.307
+2.005
31.81%
jan 1, 2007
6.419
-1.888
-22.73%
jan 1, 2008
8.836
+2.418
37.67%
jan 1, 2009
7.585
-1.251
-14.16%
jan 1, 2010
9.863
+2.278
30.03%
jan 1, 2011
5.916
-3.947
-40.02%
jan 1, 2012
9.193
+3.277
55.4%
jan 1, 2013
8.41
-0.783
-8.52%
jan 1, 2014
7.024
-1.385
-16.47%
jan 1, 2015
6.515
-0.509
-7.25%
jan 1, 2016
6.21
-0.305
-4.68%
Ranking of countries by current statistics by years


Comments: