29
/
en
AIzaSyAYiBZKx7MnpbEhh9jyipgxe19OcubqV5w
April 1, 2024
144392
Guatemala
GTM
true
2
1
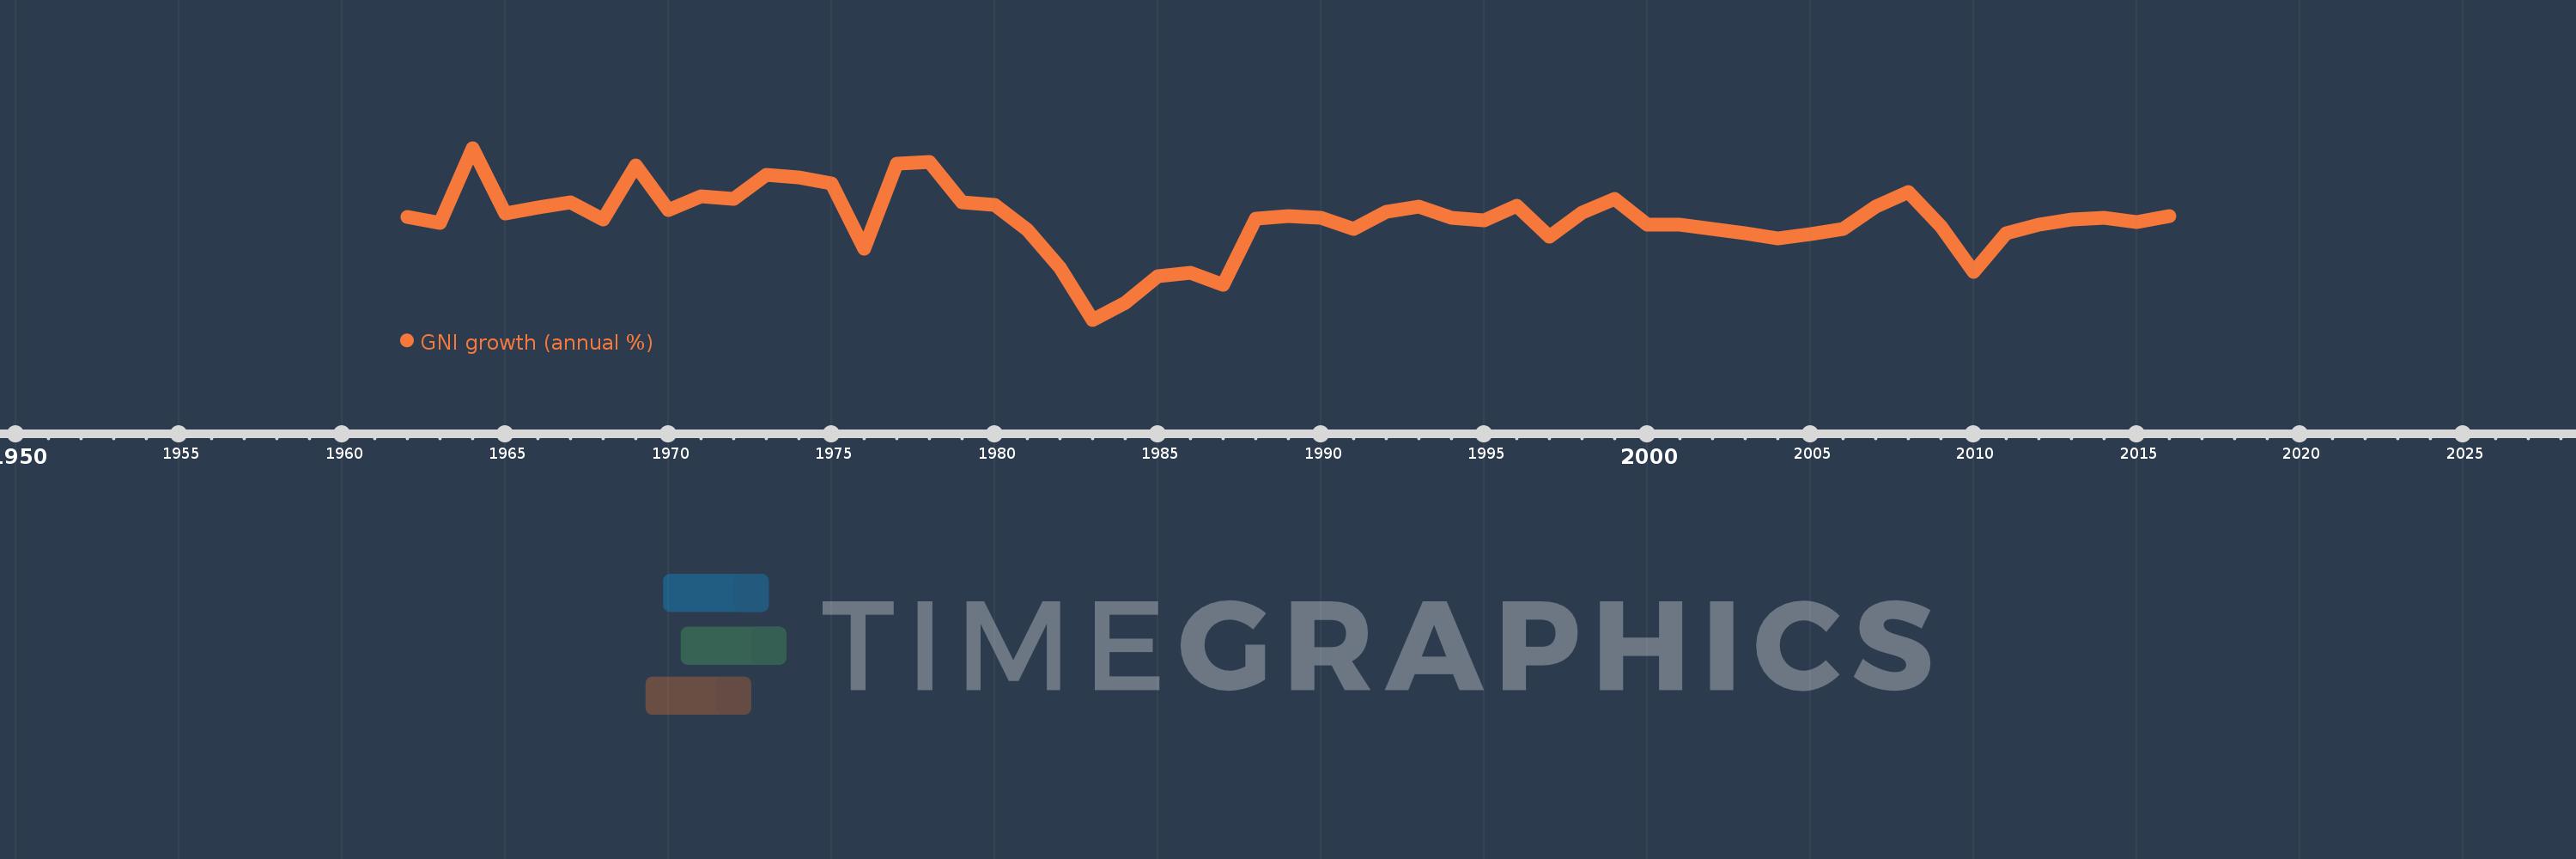
GNI growth (annual %)
2016,2015,2014,2013,2012,2011,2010,2009,2008,2007,2006,2005,2004,2003,2002,2001,2000,1999,1998,1997,1996,1995,1994,1993,1992,1991,1990,1989,1988,1987,1986,1985,1984,1983,1982,1981,1980,1979,1978,1977,1976,1975,1974,1973,1972,1971,1970,1969,1968,1967,1966,1965,1964,1963,1962
This statistics in other country:
AlbaniaAlgeriaAngolaAntigua and BarbudaArab WorldArgentinaArmeniaAustraliaAustriaAzerbaijanBahamas, TheBahrainBangladeshBarbadosBelarusBelgiumBelizeBeninBhutanBoliviaBosnia and HerzegovinaBotswanaBrazilBrunei DarussalamBulgariaBurkina FasoBurundiCabo VerdeCambodiaCameroonCanadaCaribbean small statesCentral Europe and the BalticsChadChileChinaColombiaComorosCongo, Dem. Rep.Congo, Rep.Costa RicaCote d'IvoireCroatiaCubaCyprusCzech RepublicDenmarkDjiboutiDominican RepublicEarly-demographic dividendEast Asia & PacificEast Asia & Pacific (excluding high income)East Asia & Pacific (IDA & IBRD countries)EcuadorEgypt, Arab Rep.El SalvadorEquatorial GuineaEritreaEstoniaEthiopiaEuro areaEurope & Central AsiaEurope & Central Asia (excluding high income)Europe & Central Asia (IDA & IBRD countries)European UnionFijiFinlandFranceGabonGambia, TheGeorgiaGermanyGhanaGreeceGuatemalaGuineaGuinea-BissauHaitiHeavily indebted poor countries (HIPC)High incomeHondurasHong Kong SAR, ChinaHungaryIBRD onlyIcelandIDA & IBRD totalIDA blendIDA onlyIDA totalIndiaIndonesiaIran, Islamic Rep.IrelandIsraelItalyJamaicaJapanJordanKazakhstanKenyaKorea, Rep.KosovoKuwaitKyrgyz RepublicLao PDRLate-demographic dividendLatin America & Caribbean Latin America & Caribbean (excluding high income)Latin America & the Caribbean (IDA & IBRD countries)LatviaLeast developed countries: UN classificationLebanonLiberiaLibyaLithuaniaLow & middle incomeLow incomeLower middle incomeLuxembourgMacao SAR, ChinaMacedonia, FYRMadagascarMalawiMalaysiaMaliMaltaMauritaniaMauritiusMexicoMiddle East & North AfricaMiddle East & North Africa (excluding high income)Middle East & North Africa (IDA & IBRD countries)Middle incomeMoldovaMongoliaMontenegroMoroccoMozambiqueMyanmarNamibiaNepalNetherlandsNew ZealandNicaraguaNigerNigeriaNorth AmericaNorwayOECD membersOmanOther small statesPakistanPanamaPapua New GuineaParaguayPeruPhilippinesPolandPortugalPost-demographic dividendPre-demographic dividendPuerto RicoQatarRomaniaRussian FederationRwandaSamoaSaudi ArabiaSenegalSerbiaSeychellesSierra LeoneSingaporeSlovak RepublicSloveniaSmall statesSomaliaSouth AfricaSouth AsiaSouth Asia (IDA & IBRD)South SudanSpainSri LankaSub-Saharan Africa Sub-Saharan Africa (excluding high income)Sub-Saharan Africa (IDA & IBRD countries)SudanSurinameSwazilandSwedenSwitzerlandSyrian Arab RepublicTajikistanTanzaniaThailandTimor-LesteTogoTrinidad and TobagoTunisiaTurkeyTurkmenistanUgandaUkraineUnited Arab EmiratesUnited KingdomUnited StatesUpper middle incomeUruguayUzbekistanVanuatuVenezuela, RBVietnamWest Bank and GazaWorldZambiaZimbabwe Timeline:
This timeline shows a graph from 1962 to 2016 of Guatemala. No data until 1961. Number of actual observations by date: 55.
Source name:
World Development Indicators
Source organization:
World Bank national accounts data, and OECD National Accounts data files.
Categories, topics:
Economy & Growth
Last updated:
apr 23, 2017
Indicators value changes by year
Minimum:
-3.794
jan 1, 1983
At the date of observation
Value
Absolute change
Change from previous value
jan 1, 1962
4.158
+4.158
0.0%
jan 1, 1963
3.648
-0.51
-12.27%
jan 1, 1964
9.442
+5.794
158.84%
jan 1, 1965
4.38
-5.062
-53.61%
jan 1, 1966
4.882
+0.502
11.46%
jan 1, 1967
5.227
+0.345
7.06%
jan 1, 1968
3.909
-1.318
-25.21%
jan 1, 1969
8.073
+4.164
106.51%
jan 1, 1970
4.655
-3.418
-42.34%
jan 1, 1971
5.707
+1.052
22.59%
jan 1, 1972
5.5
-0.206
-3.61%
jan 1, 1973
7.379
+1.879
34.16%
jan 1, 1974
7.19
-0.189
-2.56%
jan 1, 1975
6.688
-0.502
-6.99%
jan 1, 1976
1.681
-5.006
-74.86%
jan 1, 1977
8.201
+6.52
387.74%
jan 1, 1978
8.342
+0.141
1.71%
jan 1, 1979
5.23
-3.112
-37.31%
jan 1, 1980
5.064
-0.165
-3.16%
jan 1, 1981
3.162
-1.902
-37.56%
jan 1, 1982
0.236
-2.926
-92.54%
jan 1, 1983
-3.794
-4.03
-1.71K%
jan 1, 1984
-2.519
+1.275
-33.6%
jan 1, 1985
-0.43
+2.089
-82.93%
jan 1, 1986
-0.144
+0.286
-66.44%
jan 1, 1987
-1.092
-0.948
656.49%
jan 1, 1988
4.008
+5.099
-467.04%
jan 1, 1989
4.173
+0.165
4.13%
jan 1, 1990
4.081
-0.092
-2.21%
jan 1, 1991
3.217
-0.863
-21.16%
jan 1, 1992
4.517
+1.3
40.4%
jan 1, 1993
4.89
+0.373
8.27%
jan 1, 1994
4.05
-0.84
-17.18%
jan 1, 1995
3.859
-0.191
-4.72%
jan 1, 1996
4.959
+1.1
28.5%
jan 1, 1997
2.618
-2.341
-47.21%
jan 1, 1998
4.454
+1.837
70.17%
jan 1, 1999
5.534
+1.08
24.24%
jan 1, 2000
3.541
-1.993
-36.01%
jan 1, 2001
3.524
-0.017
-0.47%
jan 1, 2002
3.173
-0.351
-9.96%
jan 1, 2003
2.868
-0.305
-9.61%
jan 1, 2004
2.482
-0.386
-13.46%
jan 1, 2005
2.829
+0.347
13.97%
jan 1, 2006
3.202
+0.372
13.16%
jan 1, 2007
4.899
+1.698
53.03%
jan 1, 2008
6.078
+1.179
24.06%
jan 1, 2009
3.37
-2.708
-44.55%
jan 1, 2010
-0.079
-3.449
-102.34%
jan 1, 2011
2.853
+2.932
-3.72K%
jan 1, 2012
3.559
+0.706
24.76%
jan 1, 2013
3.926
+0.367
10.3%
jan 1, 2014
4.061
+0.135
3.44%
jan 1, 2015
3.727
-0.334
-8.22%
jan 1, 2016
4.179
+0.452
12.13%
Ranking of countries by current statistics by years


Comments: