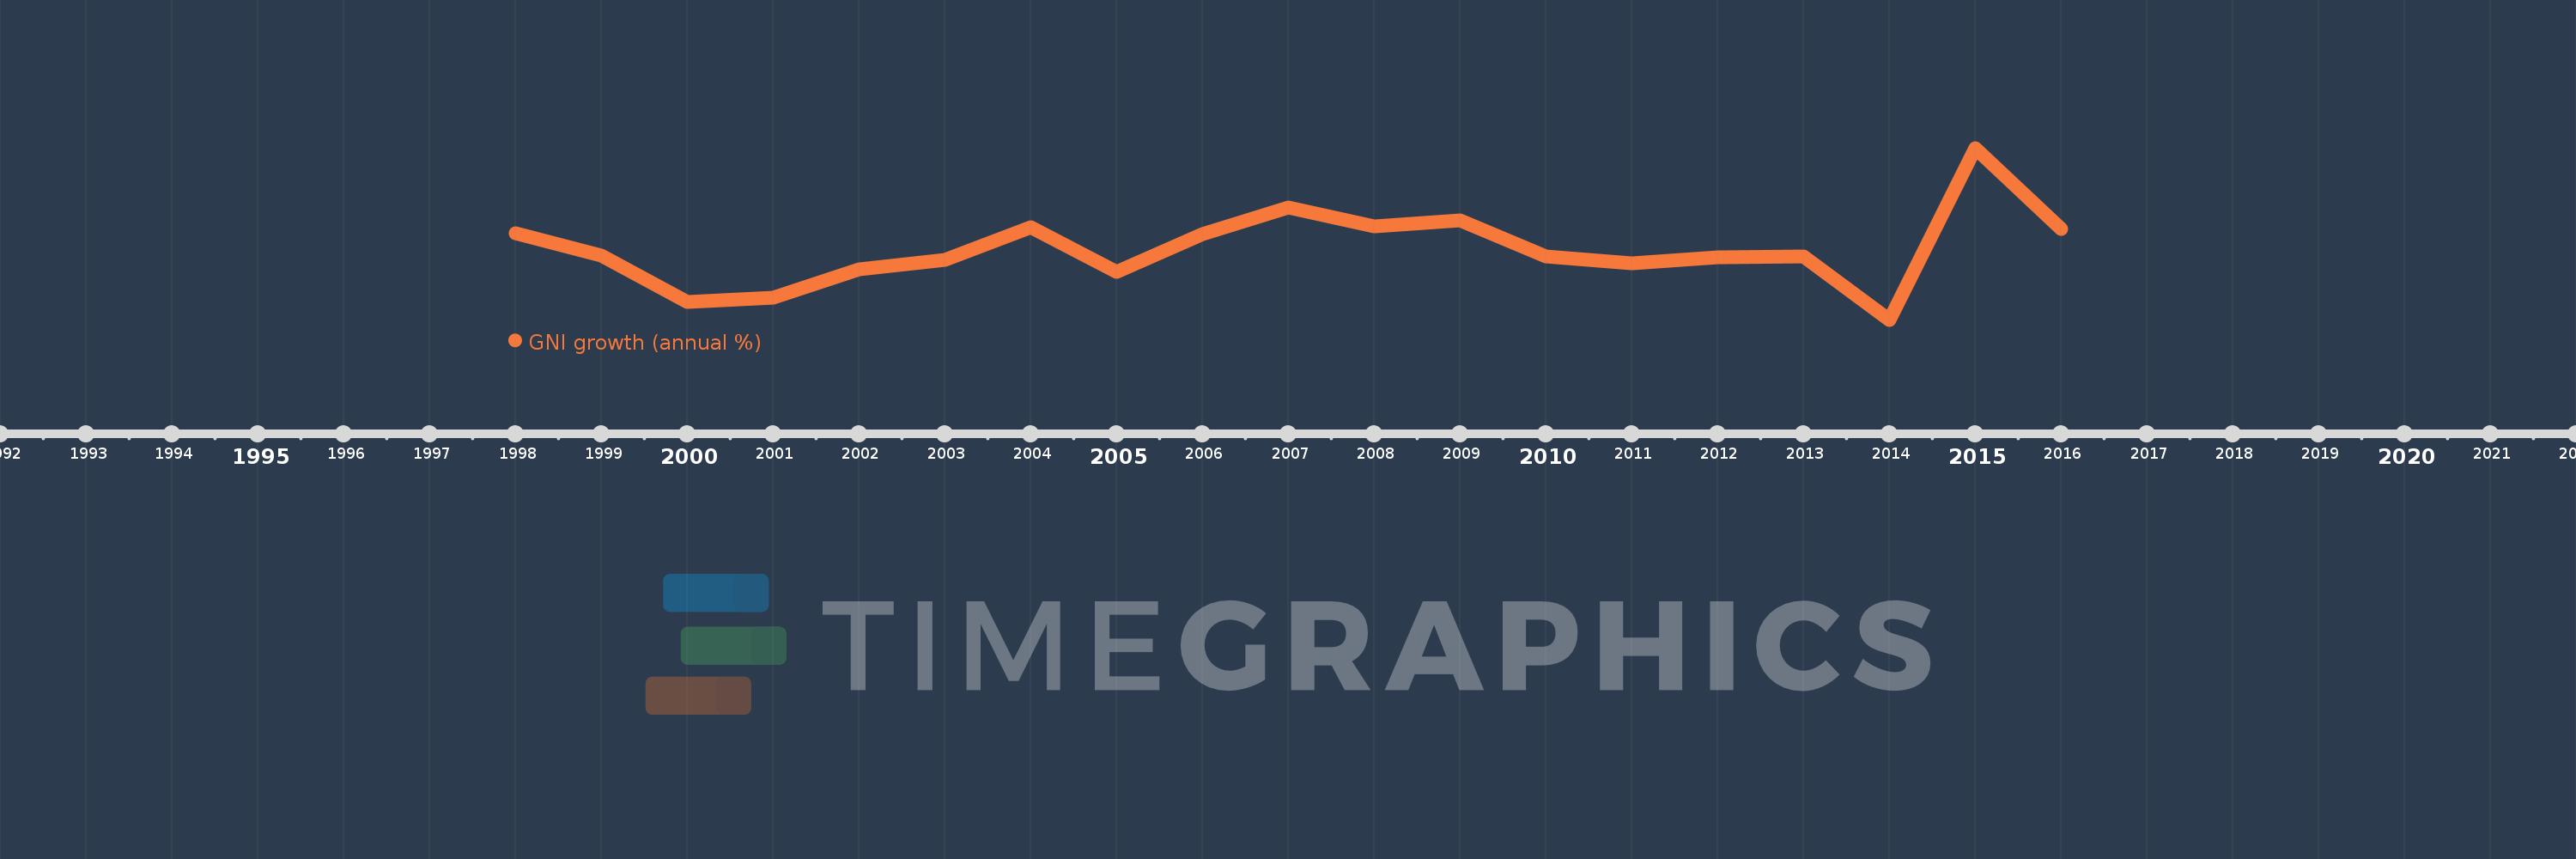
This timeline shows a graph from 1998 to 2016 of Heavily indebted poor countries (HIPC). No data until 1997. Number of actual observations by date: 19.
Source name:
World Development Indicators
Source organization:
World Bank national accounts data, and OECD National Accounts data files.
Categories, topics:
Economy & Growth
Last updated:
apr 23, 2017
Indicators value changes by year
Meaning:
4.931
Minimum:
1.392
jan 1, 2014
Maximum:
10.009
jan 1, 2015
At the date of observation
Value
Absolute change
Change from the previous value
jan 1, 1998
5.74
+5.74
0.0%
jan 1, 1999
4.61
-1.13
-19.68%
jan 1, 2000
2.305
-2.306
-50.01%
jan 1, 2001
2.491
+0.187
8.09%
jan 1, 2002
3.926
+1.434
57.58%
jan 1, 2003
4.375
+0.449
11.45%
jan 1, 2004
6.051
+1.676
38.31%
jan 1, 2005
3.785
-2.266
-37.44%
jan 1, 2006
5.672
+1.886
49.83%
jan 1, 2007
7.041
+1.37
24.15%
jan 1, 2008
6.062
-0.979
-13.91%
jan 1, 2009
6.358
+0.297
4.89%
jan 1, 2010
4.553
-1.805
-28.39%
jan 1, 2011
4.225
-0.329
-7.22%
jan 1, 2012
4.544
+0.319
7.56%
jan 1, 2013
4.583
+0.039
0.85%
jan 1, 2014
1.392
-3.191
-69.63%
jan 1, 2015
10.009
+8.617
619.27%
jan 1, 2016
5.959
-4.05
-40.46%
Ranking of countries by current statistics by years
