29
/
en
AIzaSyAYiBZKx7MnpbEhh9jyipgxe19OcubqV5w
April 1, 2024
127366
Equatorial Guinea
GNQ
true
2
1
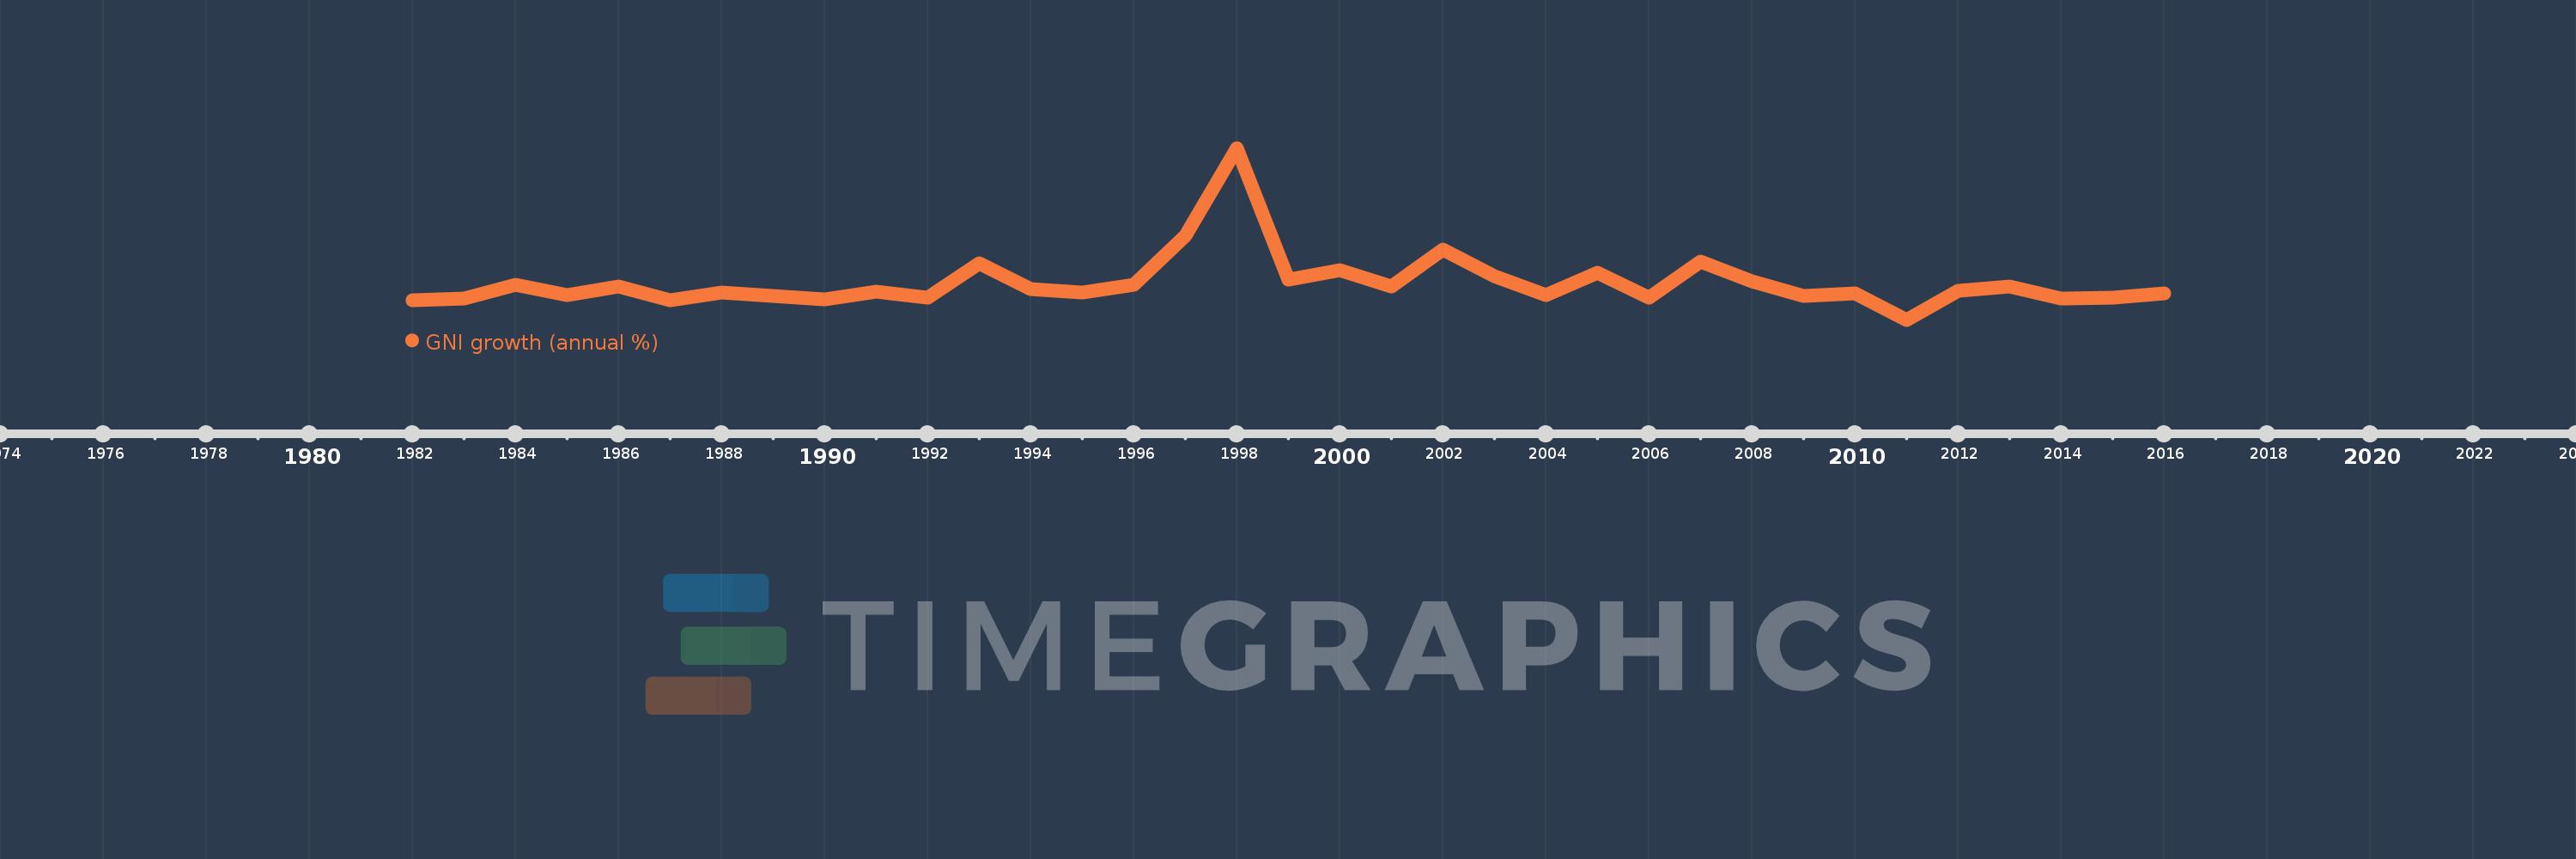
GNI growth (annual %)
2016,2015,2014,2013,2012,2011,2010,2009,2008,2007,2006,2005,2004,2003,2002,2001,2000,1999,1998,1997,1996,1995,1994,1993,1992,1991,1990,1989,1988,1987,1986,1985,1984,1983,1982
This statistics in other country:
AlbaniaAlgeriaAngolaAntigua and BarbudaArab WorldArgentinaArmeniaAustraliaAustriaAzerbaijanBahamas, TheBahrainBangladeshBarbadosBelarusBelgiumBelizeBeninBhutanBoliviaBosnia and HerzegovinaBotswanaBrazilBrunei DarussalamBulgariaBurkina FasoBurundiCabo VerdeCambodiaCameroonCanadaCaribbean small statesCentral Europe and the BalticsChadChileChinaColombiaComorosCongo, Dem. Rep.Congo, Rep.Costa RicaCote d'IvoireCroatiaCubaCyprusCzech RepublicDenmarkDjiboutiDominican RepublicEarly-demographic dividendEast Asia & PacificEast Asia & Pacific (excluding high income)East Asia & Pacific (IDA & IBRD countries)EcuadorEgypt, Arab Rep.El SalvadorEquatorial GuineaEritreaEstoniaEthiopiaEuro areaEurope & Central AsiaEurope & Central Asia (excluding high income)Europe & Central Asia (IDA & IBRD countries)European UnionFijiFinlandFranceGabonGambia, TheGeorgiaGermanyGhanaGreeceGuatemalaGuineaGuinea-BissauHaitiHeavily indebted poor countries (HIPC)High incomeHondurasHong Kong SAR, ChinaHungaryIBRD onlyIcelandIDA & IBRD totalIDA blendIDA onlyIDA totalIndiaIndonesiaIran, Islamic Rep.IrelandIsraelItalyJamaicaJapanJordanKazakhstanKenyaKorea, Rep.KosovoKuwaitKyrgyz RepublicLao PDRLate-demographic dividendLatin America & Caribbean Latin America & Caribbean (excluding high income)Latin America & the Caribbean (IDA & IBRD countries)LatviaLeast developed countries: UN classificationLebanonLiberiaLibyaLithuaniaLow & middle incomeLow incomeLower middle incomeLuxembourgMacao SAR, ChinaMacedonia, FYRMadagascarMalawiMalaysiaMaliMaltaMauritaniaMauritiusMexicoMiddle East & North AfricaMiddle East & North Africa (excluding high income)Middle East & North Africa (IDA & IBRD countries)Middle incomeMoldovaMongoliaMontenegroMoroccoMozambiqueMyanmarNamibiaNepalNetherlandsNew ZealandNicaraguaNigerNigeriaNorth AmericaNorwayOECD membersOmanOther small statesPakistanPanamaPapua New GuineaParaguayPeruPhilippinesPolandPortugalPost-demographic dividendPre-demographic dividendPuerto RicoQatarRomaniaRussian FederationRwandaSamoaSaudi ArabiaSenegalSerbiaSeychellesSierra LeoneSingaporeSlovak RepublicSloveniaSmall statesSomaliaSouth AfricaSouth AsiaSouth Asia (IDA & IBRD)South SudanSpainSri LankaSub-Saharan Africa Sub-Saharan Africa (excluding high income)Sub-Saharan Africa (IDA & IBRD countries)SudanSurinameSwazilandSwedenSwitzerlandSyrian Arab RepublicTajikistanTanzaniaThailandTimor-LesteTogoTrinidad and TobagoTunisiaTurkeyTurkmenistanUgandaUkraineUnited Arab EmiratesUnited KingdomUnited StatesUpper middle incomeUruguayUzbekistanVanuatuVenezuela, RBVietnamWest Bank and GazaWorldZambiaZimbabwe Timeline:
This timeline shows a graph from 1982 to 2016 of Equatorial Guinea. No data until 1981. Number of actual observations by date: 35.
Source name:
World Development Indicators
Source organization:
World Bank national accounts data, and OECD National Accounts data files.
Categories, topics:
Economy & Growth
Last updated:
apr 23, 2017
Indicators value changes by year
Minimum:
-23.21
jan 1, 2011
Maximum:
159.64
jan 1, 1998
At the date of observation
Value
Absolute change
Change from previous value
jan 1, 1982
-2.884
-2.884
0.0%
jan 1, 1983
-0.902
+1.982
-68.71%
jan 1, 1984
13.876
+14.778
-1.64K%
jan 1, 1985
2.897
-10.979
-79.12%
jan 1, 1986
11.749
+8.852
305.6%
jan 1, 1987
-2.036
-13.785
-117.33%
jan 1, 1988
6.053
+8.09
-397.28%
jan 1, 1989
1.976
-4.077
-67.35%
jan 1, 1990
-1.913
-3.889
-196.77%
jan 1, 1991
6.506
+8.418
-440.17%
jan 1, 1992
0.204
-6.302
-96.87%
jan 1, 1993
36.662
+36.459
17.91K%
jan 1, 1994
9.527
-27.135
-74.01%
jan 1, 1995
5.859
-3.668
-38.5%
jan 1, 1996
13.601
+7.742
132.13%
jan 1, 1997
65.811
+52.21
383.86%
jan 1, 1998
159.64
+93.829
142.57%
jan 1, 1999
19.806
-139.834
-87.59%
jan 1, 2000
29.444
+9.638
48.66%
jan 1, 2001
11.836
-17.608
-59.8%
jan 1, 2002
51.402
+39.566
334.29%
jan 1, 2003
23.478
-27.924
-54.32%
jan 1, 2004
2.642
-20.836
-88.75%
jan 1, 2005
26.62
+23.978
907.56%
jan 1, 2006
0.549
-26.071
-97.94%
jan 1, 2007
38.33
+37.781
6.88K%
jan 1, 2008
17.65
-20.68
-53.95%
jan 1, 2009
2.444
-15.206
-86.15%
jan 1, 2010
5.178
+2.734
111.86%
jan 1, 2011
-23.21
-28.388
-548.25%
jan 1, 2012
7.886
+31.096
-133.98%
jan 1, 2013
11.892
+4.006
50.8%
jan 1, 2014
-1.084
-12.976
-109.12%
jan 1, 2015
0.445
+1.529
-140.99%
jan 1, 2016
4.634
+4.19
942.52%
Ranking of countries by current statistics by years


Comments: