29
/
en
AIzaSyAYiBZKx7MnpbEhh9jyipgxe19OcubqV5w
April 1, 2024
194247
Mauritius
MUS
true
2
1
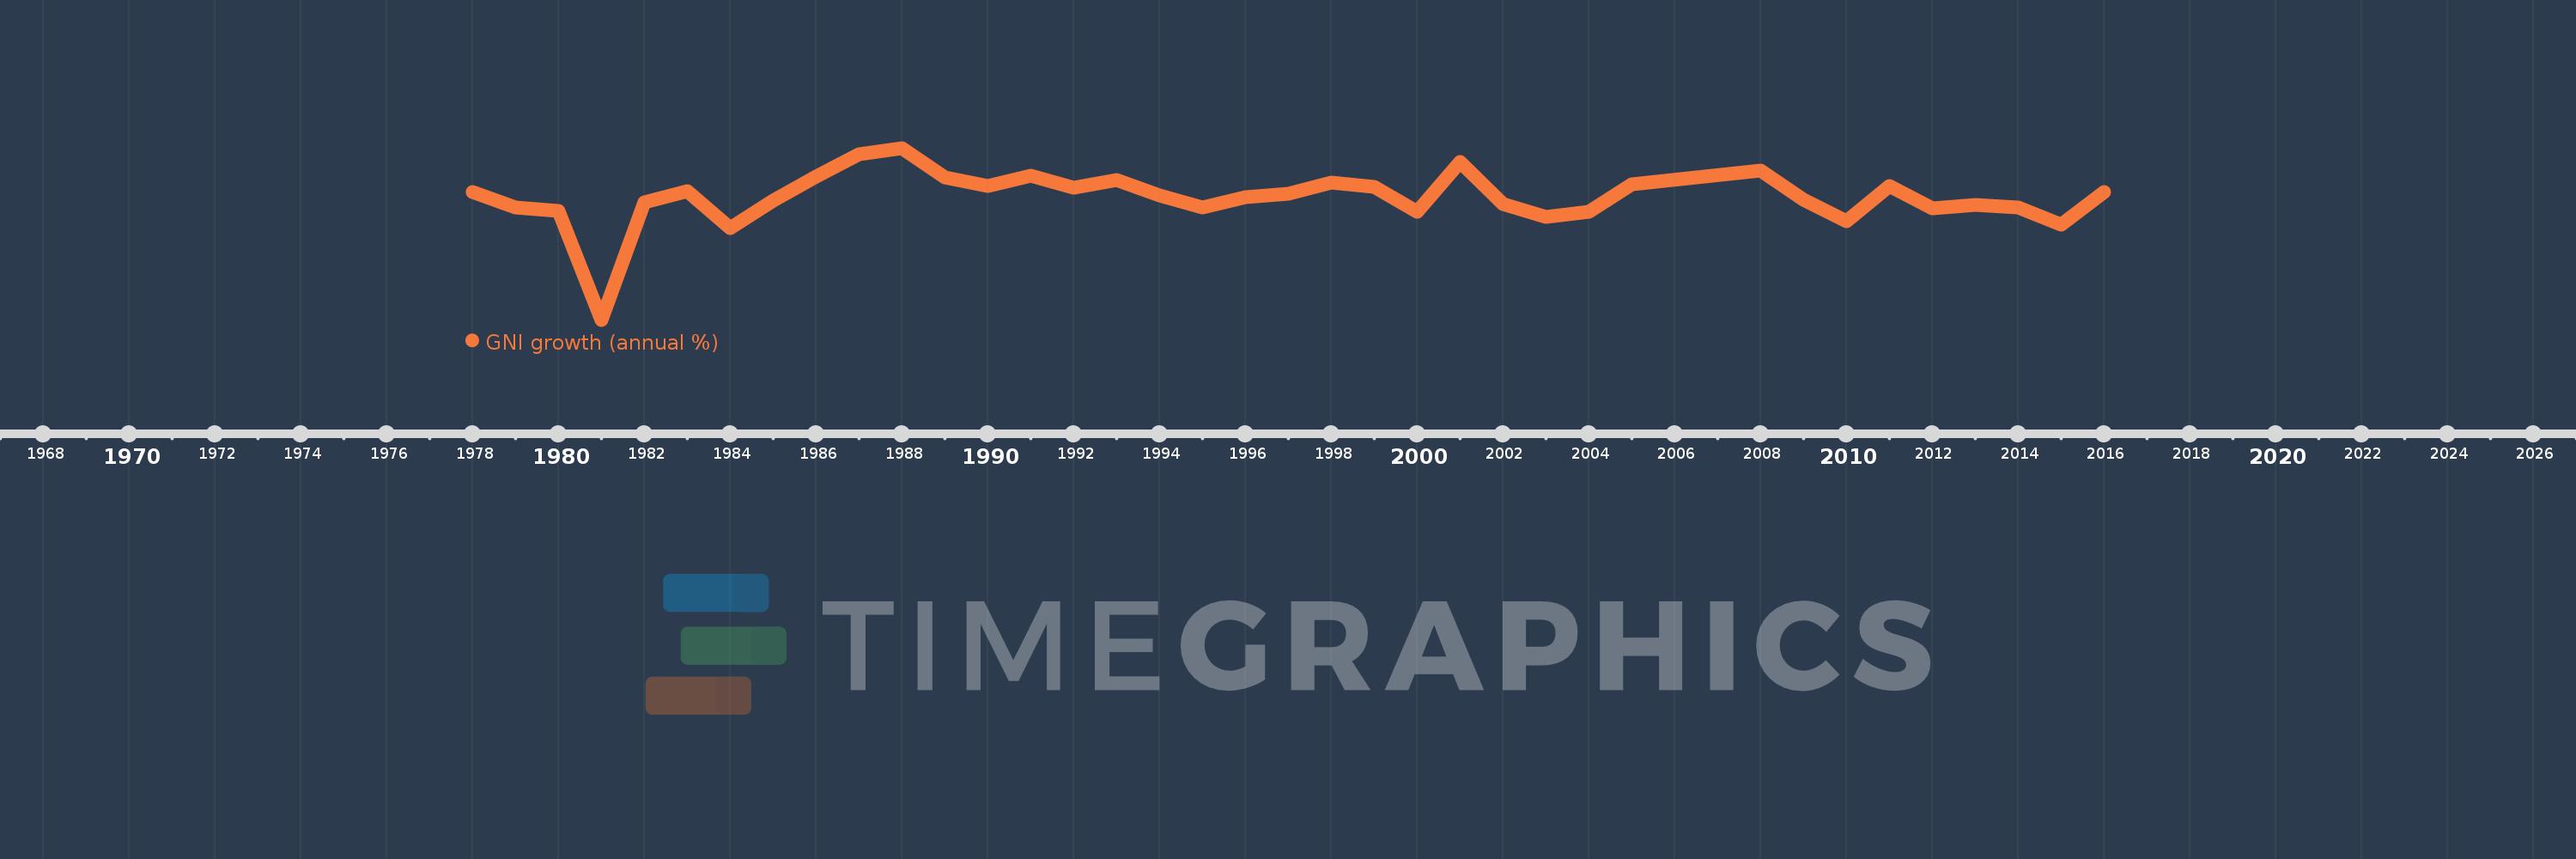
GNI growth (annual %)
2016,2015,2014,2013,2012,2011,2010,2009,2008,2005,2004,2003,2002,2001,2000,1999,1998,1997,1996,1995,1994,1993,1992,1991,1990,1989,1988,1987,1986,1985,1984,1983,1982,1981,1980,1979,1978
This statistics in other country:
AlbaniaAlgeriaAngolaAntigua and BarbudaArab WorldArgentinaArmeniaAustraliaAustriaAzerbaijanBahamas, TheBahrainBangladeshBarbadosBelarusBelgiumBelizeBeninBhutanBoliviaBosnia and HerzegovinaBotswanaBrazilBrunei DarussalamBulgariaBurkina FasoBurundiCabo VerdeCambodiaCameroonCanadaCaribbean small statesCentral Europe and the BalticsChadChileChinaColombiaComorosCongo, Dem. Rep.Congo, Rep.Costa RicaCote d'IvoireCroatiaCubaCyprusCzech RepublicDenmarkDjiboutiDominican RepublicEarly-demographic dividendEast Asia & PacificEast Asia & Pacific (excluding high income)East Asia & Pacific (IDA & IBRD countries)EcuadorEgypt, Arab Rep.El SalvadorEquatorial GuineaEritreaEstoniaEthiopiaEuro areaEurope & Central AsiaEurope & Central Asia (excluding high income)Europe & Central Asia (IDA & IBRD countries)European UnionFijiFinlandFranceGabonGambia, TheGeorgiaGermanyGhanaGreeceGuatemalaGuineaGuinea-BissauHaitiHeavily indebted poor countries (HIPC)High incomeHondurasHong Kong SAR, ChinaHungaryIBRD onlyIcelandIDA & IBRD totalIDA blendIDA onlyIDA totalIndiaIndonesiaIran, Islamic Rep.IrelandIsraelItalyJamaicaJapanJordanKazakhstanKenyaKorea, Rep.KosovoKuwaitKyrgyz RepublicLao PDRLate-demographic dividendLatin America & Caribbean Latin America & Caribbean (excluding high income)Latin America & the Caribbean (IDA & IBRD countries)LatviaLeast developed countries: UN classificationLebanonLiberiaLibyaLithuaniaLow & middle incomeLow incomeLower middle incomeLuxembourgMacao SAR, ChinaMacedonia, FYRMadagascarMalawiMalaysiaMaliMaltaMauritaniaMauritiusMexicoMiddle East & North AfricaMiddle East & North Africa (excluding high income)Middle East & North Africa (IDA & IBRD countries)Middle incomeMoldovaMongoliaMontenegroMoroccoMozambiqueMyanmarNamibiaNepalNetherlandsNew ZealandNicaraguaNigerNigeriaNorth AmericaNorwayOECD membersOmanOther small statesPakistanPanamaPapua New GuineaParaguayPeruPhilippinesPolandPortugalPost-demographic dividendPre-demographic dividendPuerto RicoQatarRomaniaRussian FederationRwandaSamoaSaudi ArabiaSenegalSerbiaSeychellesSierra LeoneSingaporeSlovak RepublicSloveniaSmall statesSomaliaSouth AfricaSouth AsiaSouth Asia (IDA & IBRD)South SudanSpainSri LankaSub-Saharan Africa Sub-Saharan Africa (excluding high income)Sub-Saharan Africa (IDA & IBRD countries)SudanSurinameSwazilandSwedenSwitzerlandSyrian Arab RepublicTajikistanTanzaniaThailandTimor-LesteTogoTrinidad and TobagoTunisiaTurkeyTurkmenistanUgandaUkraineUnited Arab EmiratesUnited KingdomUnited StatesUpper middle incomeUruguayUzbekistanVanuatuVenezuela, RBVietnamWest Bank and GazaWorldZambiaZimbabwe Timeline:
This timeline shows a graph from 1978 to 2016 of Mauritius. No data until 1977. Number of actual observations by date: 37.
Source name:
World Development Indicators
Source organization:
World Bank national accounts data, and OECD National Accounts data files.
Categories, topics:
Economy & Growth
Last updated:
apr 23, 2017
Indicators value changes by year
Minimum:
-10.643
jan 1, 1981
Maximum:
10.649
jan 1, 1988
At the date of observation
Value
Absolute change
Change from previous value
jan 1, 1978
5.188
+5.188
0.0%
jan 1, 1979
3.324
-1.864
-35.93%
jan 1, 1980
2.837
-0.487
-14.66%
jan 1, 1981
-10.643
-13.48
-475.2%
jan 1, 1982
3.882
+14.525
-136.48%
jan 1, 1983
5.278
+1.395
35.94%
jan 1, 1984
0.709
-4.569
-86.56%
jan 1, 1985
4.117
+3.408
480.39%
jan 1, 1986
7.153
+3.036
73.74%
jan 1, 1987
9.904
+2.751
38.46%
jan 1, 1988
10.649
+0.745
7.52%
jan 1, 1989
7.003
-3.646
-34.24%
jan 1, 1990
5.896
-1.107
-15.81%
jan 1, 1991
7.22
+1.324
22.46%
jan 1, 1992
5.679
-1.541
-21.34%
jan 1, 1993
6.679
+0.999
17.59%
jan 1, 1994
4.812
-1.867
-27.95%
jan 1, 1995
3.239
-1.573
-32.69%
jan 1, 1996
4.536
+1.298
40.07%
jan 1, 1997
4.964
+0.428
9.43%
jan 1, 1998
6.363
+1.399
28.19%
jan 1, 1999
5.792
-0.571
-8.97%
jan 1, 2000
2.716
-3.076
-53.11%
jan 1, 2001
8.916
+6.2
228.24%
jan 1, 2002
3.661
-5.255
-58.93%
jan 1, 2003
2.098
-1.563
-42.69%
jan 1, 2004
2.72
+0.622
29.64%
jan 1, 2005
6.119
+3.399
124.94%
jan 1, 2008
7.84
+1.722
28.13%
jan 1, 2009
4.217
-3.623
-46.21%
jan 1, 2010
1.548
-2.669
-63.3%
jan 1, 2011
5.945
+4.397
284.16%
jan 1, 2012
3.213
-2.732
-45.95%
jan 1, 2013
3.556
+0.343
10.69%
jan 1, 2014
3.231
-0.325
-9.14%
jan 1, 2015
1.152
-2.08
-64.36%
jan 1, 2016
5.186
+4.034
350.27%
Ranking of countries by current statistics by years


Comments: