29
/
en
AIzaSyAYiBZKx7MnpbEhh9jyipgxe19OcubqV5w
April 1, 2024
190257
Mali
MLI
true
2
1
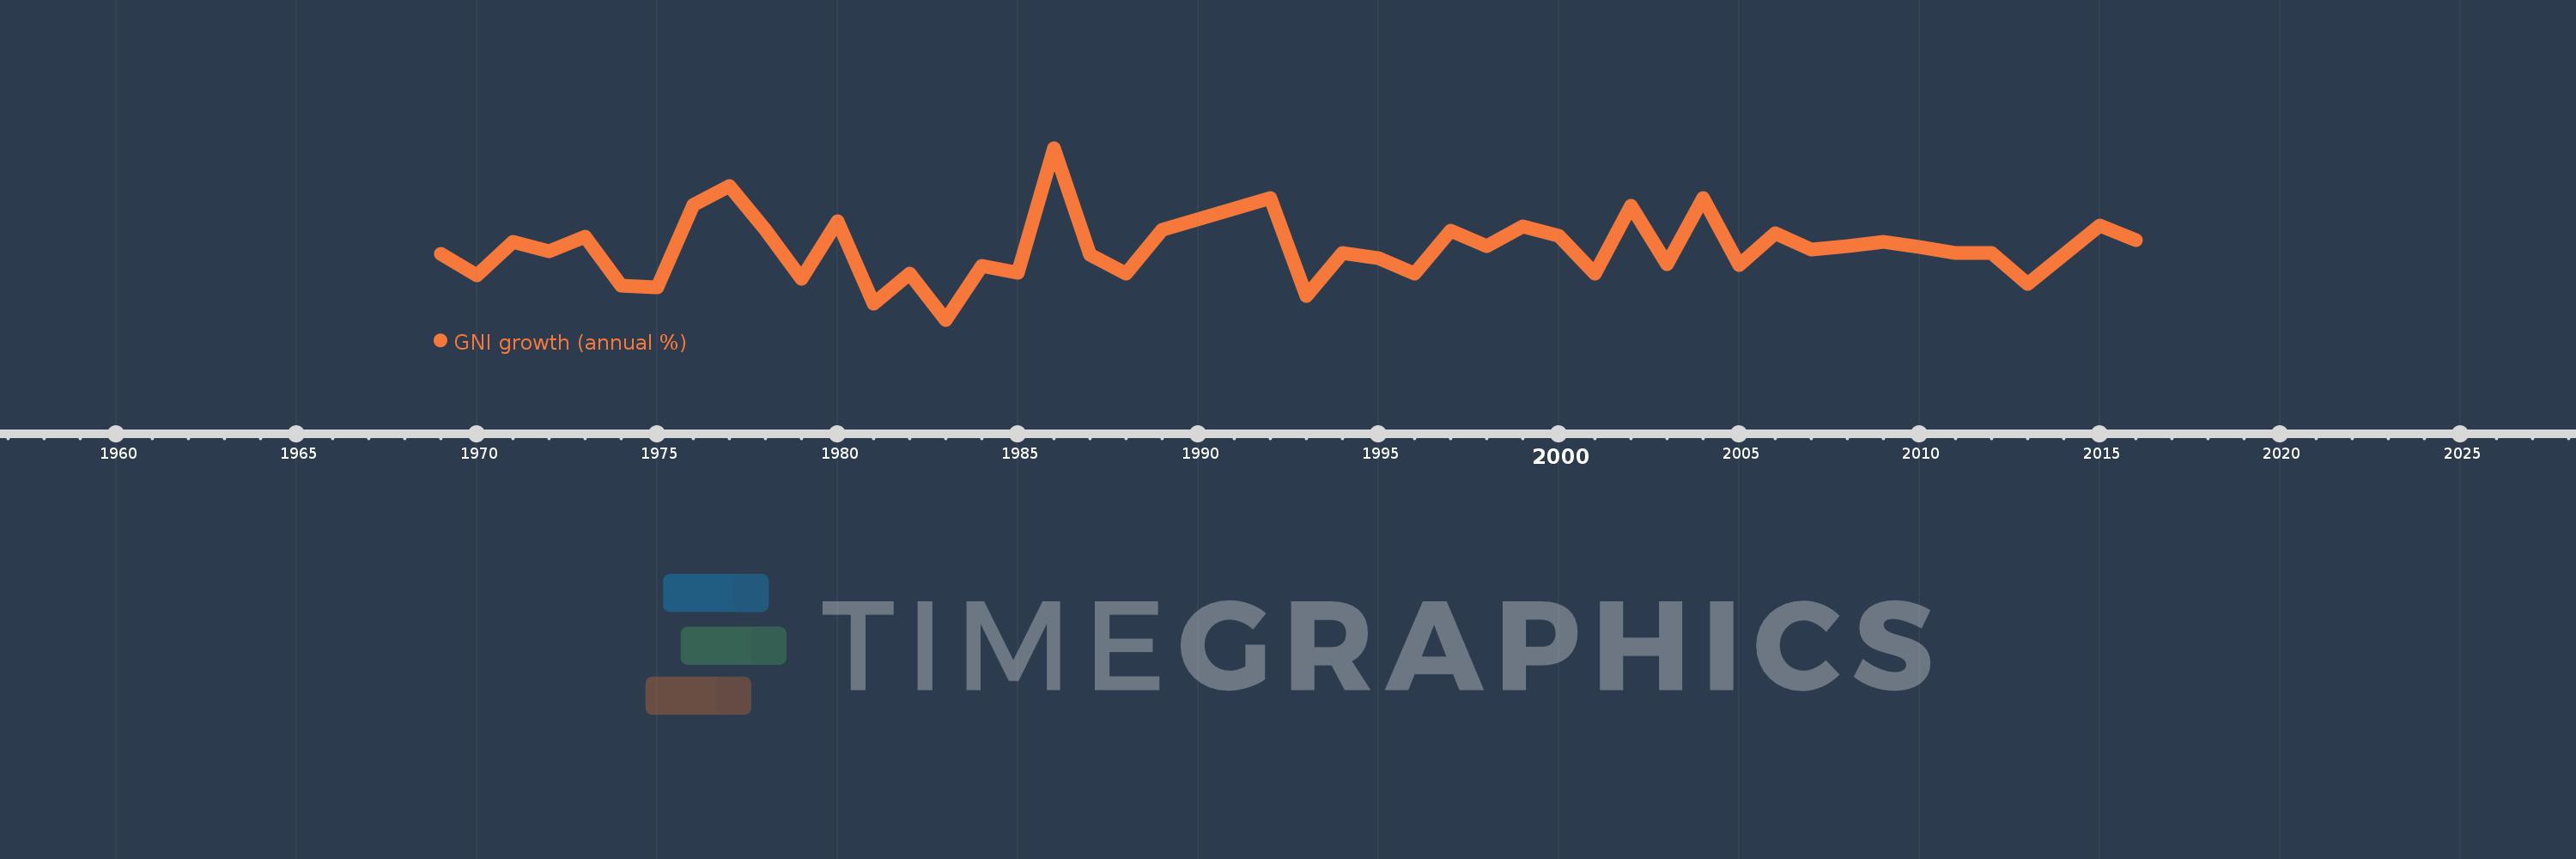
GNI growth (annual %)
2016,2015,2014,2013,2012,2011,2010,2009,2008,2007,2006,2005,2004,2003,2002,2001,2000,1999,1998,1997,1996,1995,1994,1993,1992,1989,1988,1987,1986,1985,1984,1983,1982,1981,1980,1979,1978,1977,1976,1975,1974,1973,1972,1971,1970,1969
This statistics in other country:
AlbaniaAlgeriaAngolaAntigua and BarbudaArab WorldArgentinaArmeniaAustraliaAustriaAzerbaijanBahamas, TheBahrainBangladeshBarbadosBelarusBelgiumBelizeBeninBhutanBoliviaBosnia and HerzegovinaBotswanaBrazilBrunei DarussalamBulgariaBurkina FasoBurundiCabo VerdeCambodiaCameroonCanadaCaribbean small statesCentral Europe and the BalticsChadChileChinaColombiaComorosCongo, Dem. Rep.Congo, Rep.Costa RicaCote d'IvoireCroatiaCubaCyprusCzech RepublicDenmarkDjiboutiDominican RepublicEarly-demographic dividendEast Asia & PacificEast Asia & Pacific (excluding high income)East Asia & Pacific (IDA & IBRD countries)EcuadorEgypt, Arab Rep.El SalvadorEquatorial GuineaEritreaEstoniaEthiopiaEuro areaEurope & Central AsiaEurope & Central Asia (excluding high income)Europe & Central Asia (IDA & IBRD countries)European UnionFijiFinlandFranceGabonGambia, TheGeorgiaGermanyGhanaGreeceGuatemalaGuineaGuinea-BissauHaitiHeavily indebted poor countries (HIPC)High incomeHondurasHong Kong SAR, ChinaHungaryIBRD onlyIcelandIDA & IBRD totalIDA blendIDA onlyIDA totalIndiaIndonesiaIran, Islamic Rep.IrelandIsraelItalyJamaicaJapanJordanKazakhstanKenyaKorea, Rep.KosovoKuwaitKyrgyz RepublicLao PDRLate-demographic dividendLatin America & Caribbean Latin America & Caribbean (excluding high income)Latin America & the Caribbean (IDA & IBRD countries)LatviaLeast developed countries: UN classificationLebanonLiberiaLibyaLithuaniaLow & middle incomeLow incomeLower middle incomeLuxembourgMacao SAR, ChinaMacedonia, FYRMadagascarMalawiMalaysiaMaliMaltaMauritaniaMauritiusMexicoMiddle East & North AfricaMiddle East & North Africa (excluding high income)Middle East & North Africa (IDA & IBRD countries)Middle incomeMoldovaMongoliaMontenegroMoroccoMozambiqueMyanmarNamibiaNepalNetherlandsNew ZealandNicaraguaNigerNigeriaNorth AmericaNorwayOECD membersOmanOther small statesPakistanPanamaPapua New GuineaParaguayPeruPhilippinesPolandPortugalPost-demographic dividendPre-demographic dividendPuerto RicoQatarRomaniaRussian FederationRwandaSamoaSaudi ArabiaSenegalSerbiaSeychellesSierra LeoneSingaporeSlovak RepublicSloveniaSmall statesSomaliaSouth AfricaSouth AsiaSouth Asia (IDA & IBRD)South SudanSpainSri LankaSub-Saharan Africa Sub-Saharan Africa (excluding high income)Sub-Saharan Africa (IDA & IBRD countries)SudanSurinameSwazilandSwedenSwitzerlandSyrian Arab RepublicTajikistanTanzaniaThailandTimor-LesteTogoTrinidad and TobagoTunisiaTurkeyTurkmenistanUgandaUkraineUnited Arab EmiratesUnited KingdomUnited StatesUpper middle incomeUruguayUzbekistanVanuatuVenezuela, RBVietnamWest Bank and GazaWorldZambiaZimbabwe Timeline:
This timeline shows a graph from 1969 to 2016 of Mali. No data until 1968. Number of actual observations by date: 46.
Source name:
World Development Indicators
Source organization:
World Bank national accounts data, and OECD National Accounts data files.
Categories, topics:
Economy & Growth
Last updated:
apr 23, 2017
Indicators value changes by year
Minimum:
-7.115
jan 1, 1983
Maximum:
20.213
jan 1, 1986
At the date of observation
Value
Absolute change
Change from previous value
jan 1, 1969
3.336
+3.336
0.0%
jan 1, 1970
0.0
-3.336
-100.0%
jan 1, 1971
5.317
+5.317
-75.24 mln%
jan 1, 1972
3.843
-1.474
-27.72%
jan 1, 1973
6.058
+2.215
57.63%
jan 1, 1974
-1.69
-7.748
-127.89%
jan 1, 1975
-1.928
-0.238
14.1%
jan 1, 1976
11.129
+13.057
-677.28%
jan 1, 1977
14.123
+2.994
26.9%
jan 1, 1978
7.221
-6.901
-48.87%
jan 1, 1979
-0.642
-7.864
-108.89%
jan 1, 1980
8.57
+9.213
-1.43K%
jan 1, 1981
-4.55
-13.12
-153.09%
jan 1, 1982
0.261
+4.811
-105.73%
jan 1, 1983
-7.115
-7.375
-2.83K%
jan 1, 1984
1.454
+8.569
-120.44%
jan 1, 1985
0.293
-1.161
-79.85%
jan 1, 1986
20.213
+19.92
6.8K%
jan 1, 1987
3.231
-16.982
-84.02%
jan 1, 1988
0.193
-3.038
-94.03%
jan 1, 1989
7.165
+6.972
3.62K%
jan 1, 1992
12.309
+5.144
71.79%
jan 1, 1993
-3.369
-15.678
-127.37%
jan 1, 1994
3.516
+6.885
-204.37%
jan 1, 1995
2.619
-0.898
-25.53%
jan 1, 1996
0.251
-2.367
-90.4%
jan 1, 1997
7.005
+6.754
2.69K%
jan 1, 1998
4.606
-2.4
-34.25%
jan 1, 1999
7.73
+3.125
67.84%
jan 1, 2000
6.253
-1.478
-19.11%
jan 1, 2001
0.238
-6.015
-96.2%
jan 1, 2002
11.058
+10.82
4.55K%
jan 1, 2003
1.711
-9.347
-84.53%
jan 1, 2004
12.244
+10.534
615.68%
jan 1, 2005
1.615
-10.629
-86.81%
jan 1, 2006
6.619
+5.004
309.81%
jan 1, 2007
4.057
-2.562
-38.71%
jan 1, 2008
4.612
+0.555
13.67%
jan 1, 2009
5.23
+0.619
13.42%
jan 1, 2010
4.49
-0.74
-14.16%
jan 1, 2011
3.537
-0.953
-21.22%
jan 1, 2012
3.503
-0.034
-0.95%
jan 1, 2013
-1.463
-4.967
-141.76%
jan 1, 2014
3.211
+4.674
-319.43%
jan 1, 2015
7.84
+4.629
144.19%
jan 1, 2016
5.487
-2.353
-30.01%
Ranking of countries by current statistics by years


Comments: