29
/
en
AIzaSyAYiBZKx7MnpbEhh9jyipgxe19OcubqV5w
April 1, 2024
124822
Egypt, Arab Rep.
EGY
true
2
1
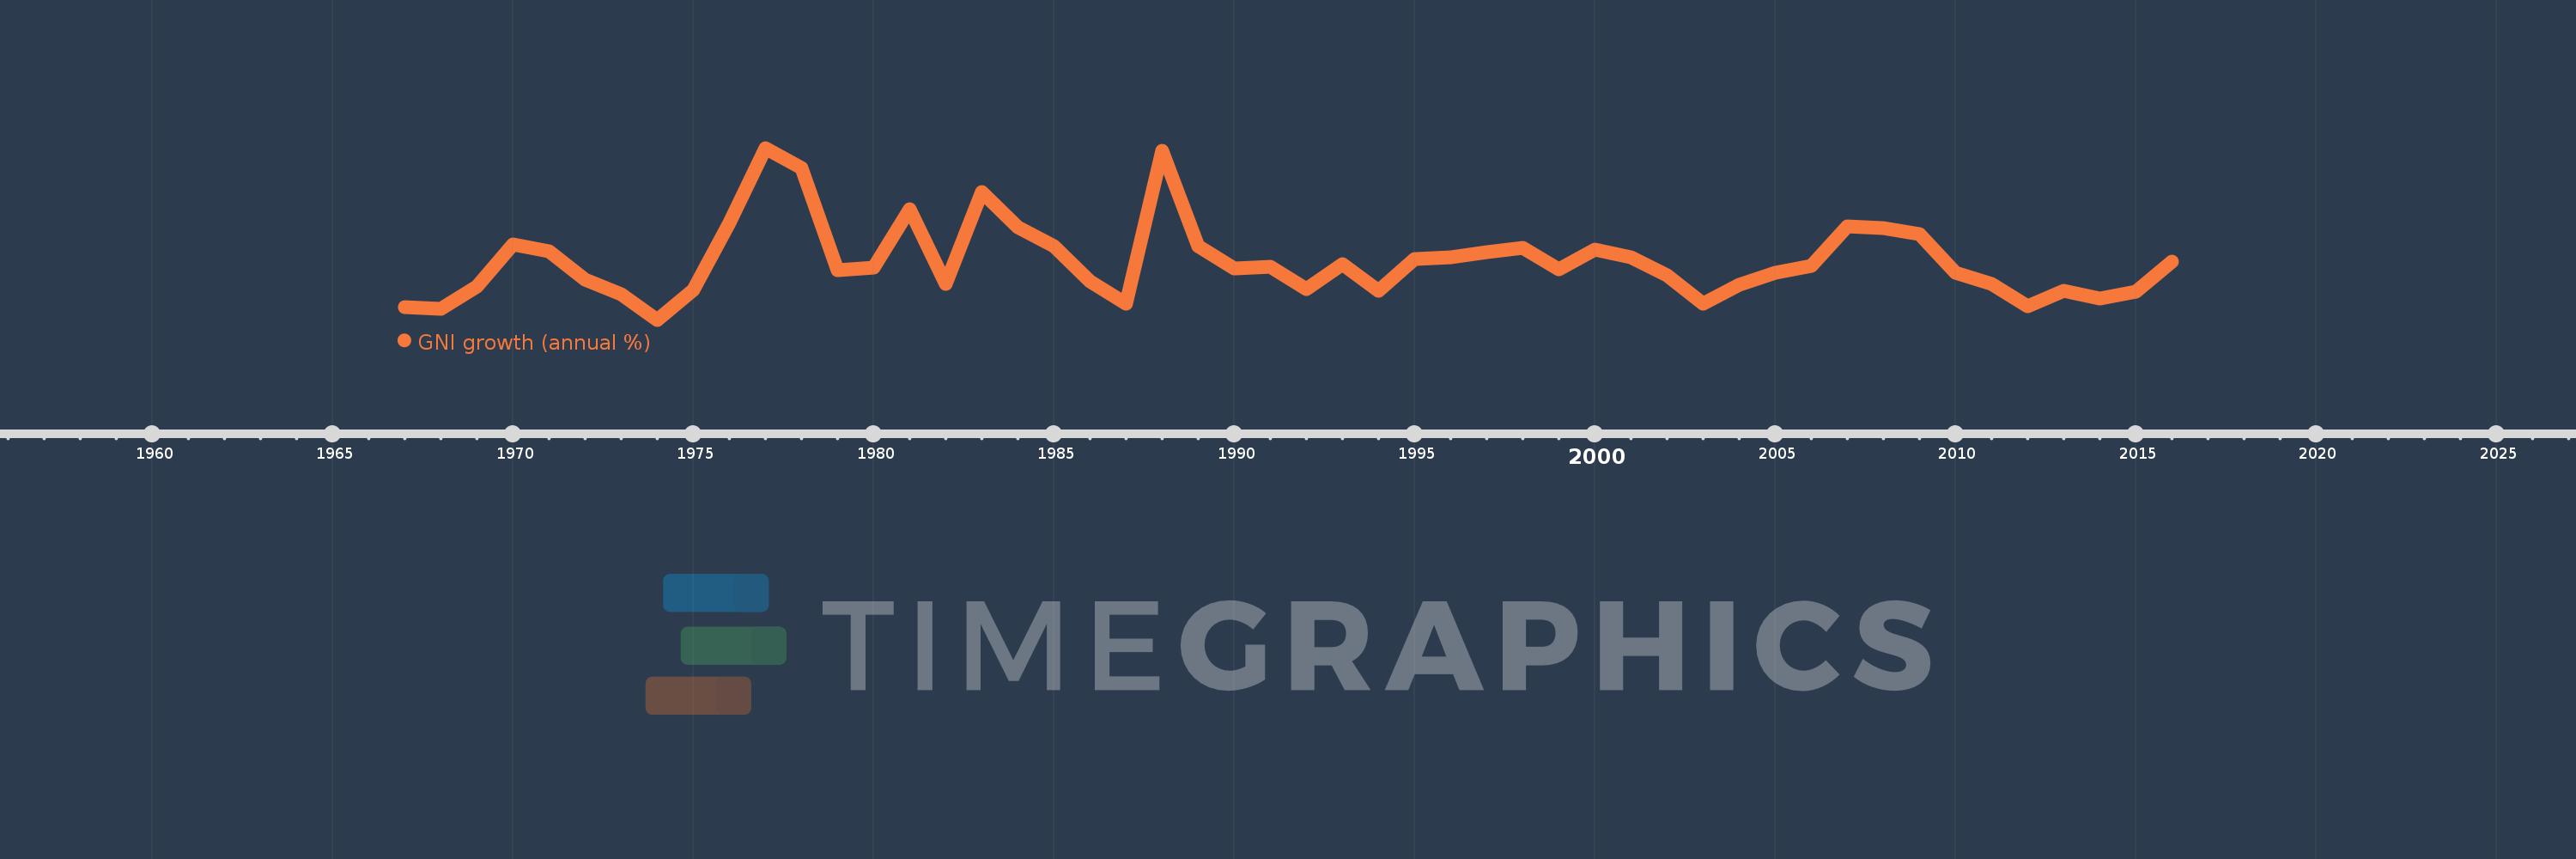
GNI growth (annual %)
2016,2015,2014,2013,2012,2011,2010,2009,2008,2007,2006,2005,2004,2003,2002,2001,2000,1999,1998,1997,1996,1995,1994,1993,1992,1991,1990,1989,1988,1987,1986,1985,1984,1983,1982,1981,1980,1979,1978,1977,1976,1975,1974,1973,1972,1971,1970,1969,1968,1967
This statistics in other country:
AlbaniaAlgeriaAngolaAntigua and BarbudaArab WorldArgentinaArmeniaAustraliaAustriaAzerbaijanBahamas, TheBahrainBangladeshBarbadosBelarusBelgiumBelizeBeninBhutanBoliviaBosnia and HerzegovinaBotswanaBrazilBrunei DarussalamBulgariaBurkina FasoBurundiCabo VerdeCambodiaCameroonCanadaCaribbean small statesCentral Europe and the BalticsChadChileChinaColombiaComorosCongo, Dem. Rep.Congo, Rep.Costa RicaCote d'IvoireCroatiaCubaCyprusCzech RepublicDenmarkDjiboutiDominican RepublicEarly-demographic dividendEast Asia & PacificEast Asia & Pacific (excluding high income)East Asia & Pacific (IDA & IBRD countries)EcuadorEgypt, Arab Rep.El SalvadorEquatorial GuineaEritreaEstoniaEthiopiaEuro areaEurope & Central AsiaEurope & Central Asia (excluding high income)Europe & Central Asia (IDA & IBRD countries)European UnionFijiFinlandFranceGabonGambia, TheGeorgiaGermanyGhanaGreeceGuatemalaGuineaGuinea-BissauHaitiHeavily indebted poor countries (HIPC)High incomeHondurasHong Kong SAR, ChinaHungaryIBRD onlyIcelandIDA & IBRD totalIDA blendIDA onlyIDA totalIndiaIndonesiaIran, Islamic Rep.IrelandIsraelItalyJamaicaJapanJordanKazakhstanKenyaKorea, Rep.KosovoKuwaitKyrgyz RepublicLao PDRLate-demographic dividendLatin America & Caribbean Latin America & Caribbean (excluding high income)Latin America & the Caribbean (IDA & IBRD countries)LatviaLeast developed countries: UN classificationLebanonLiberiaLibyaLithuaniaLow & middle incomeLow incomeLower middle incomeLuxembourgMacao SAR, ChinaMacedonia, FYRMadagascarMalawiMalaysiaMaliMaltaMauritaniaMauritiusMexicoMiddle East & North AfricaMiddle East & North Africa (excluding high income)Middle East & North Africa (IDA & IBRD countries)Middle incomeMoldovaMongoliaMontenegroMoroccoMozambiqueMyanmarNamibiaNepalNetherlandsNew ZealandNicaraguaNigerNigeriaNorth AmericaNorwayOECD membersOmanOther small statesPakistanPanamaPapua New GuineaParaguayPeruPhilippinesPolandPortugalPost-demographic dividendPre-demographic dividendPuerto RicoQatarRomaniaRussian FederationRwandaSamoaSaudi ArabiaSenegalSerbiaSeychellesSierra LeoneSingaporeSlovak RepublicSloveniaSmall statesSomaliaSouth AfricaSouth AsiaSouth Asia (IDA & IBRD)South SudanSpainSri LankaSub-Saharan Africa Sub-Saharan Africa (excluding high income)Sub-Saharan Africa (IDA & IBRD countries)SudanSurinameSwazilandSwedenSwitzerlandSyrian Arab RepublicTajikistanTanzaniaThailandTimor-LesteTogoTrinidad and TobagoTunisiaTurkeyTurkmenistanUgandaUkraineUnited Arab EmiratesUnited KingdomUnited StatesUpper middle incomeUruguayUzbekistanVanuatuVenezuela, RBVietnamWest Bank and GazaWorldZambiaZimbabwe Timeline:
This timeline shows a graph from 1967 to 2016 of Egypt, Arab Rep.. No data until 1966. Number of actual observations by date: 50.
Source name:
World Development Indicators
Source organization:
World Bank national accounts data, and OECD National Accounts data files.
Categories, topics:
Economy & Growth
Last updated:
apr 23, 2017
Indicators value changes by year
At the date of observation
Value
Absolute change
Change from previous value
jan 1, 1967
1.095
+1.095
0.0%
jan 1, 1968
0.957
-0.138
-12.57%
jan 1, 1969
2.804
+1.847
192.9%
jan 1, 1970
6.224
+3.42
121.94%
jan 1, 1971
5.629
-0.595
-9.57%
jan 1, 1972
3.392
-2.236
-39.73%
jan 1, 1973
2.15
-1.242
-36.62%
jan 1, 1974
0.103
-2.046
-95.19%
jan 1, 1975
2.493
+2.389
2.31K%
jan 1, 1976
7.99
+5.497
220.53%
jan 1, 1977
14.04
+6.05
75.71%
jan 1, 1978
12.423
-1.617
-11.52%
jan 1, 1979
4.136
-8.287
-66.71%
jan 1, 1980
4.351
+0.216
5.21%
jan 1, 1981
9.062
+4.711
108.27%
jan 1, 1982
3.006
-6.056
-66.83%
jan 1, 1983
10.438
+7.432
247.21%
jan 1, 1984
7.6
-2.838
-27.19%
jan 1, 1985
6.061
-1.54
-20.26%
jan 1, 1986
3.24
-2.821
-46.54%
jan 1, 1987
1.405
-1.835
-56.64%
jan 1, 1988
13.83
+12.425
884.42%
jan 1, 1989
6.088
-7.742
-55.98%
jan 1, 1990
4.276
-1.812
-29.77%
jan 1, 1991
4.383
+0.107
2.51%
jan 1, 1992
2.603
-1.78
-40.62%
jan 1, 1993
4.621
+2.019
77.57%
jan 1, 1994
2.423
-2.198
-47.57%
jan 1, 1995
5.046
+2.623
108.23%
jan 1, 1996
5.139
+0.093
1.84%
jan 1, 1997
5.573
+0.434
8.46%
jan 1, 1998
5.947
+0.374
6.71%
jan 1, 1999
4.21
-1.737
-29.21%
jan 1, 2000
5.78
+1.57
37.29%
jan 1, 2001
5.194
-0.586
-10.14%
jan 1, 2002
3.713
-1.481
-28.51%
jan 1, 2003
1.374
-2.339
-63.0%
jan 1, 2004
2.947
+1.573
114.46%
jan 1, 2005
3.941
+0.994
33.74%
jan 1, 2006
4.46
+0.519
13.18%
jan 1, 2007
7.693
+3.233
72.5%
jan 1, 2008
7.519
-0.174
-2.27%
jan 1, 2009
7.077
-0.442
-5.88%
jan 1, 2010
3.895
-3.181
-44.96%
jan 1, 2011
2.99
-0.905
-23.24%
jan 1, 2012
1.167
-1.823
-60.98%
jan 1, 2013
2.454
+1.287
110.31%
jan 1, 2014
1.834
-0.619
-25.25%
jan 1, 2015
2.415
+0.58
31.64%
jan 1, 2016
4.825
+2.411
99.85%
Ranking of countries by current statistics by years


Comments: