29
/
en
AIzaSyAYiBZKx7MnpbEhh9jyipgxe19OcubqV5w
April 1, 2024
58914
Sub-Saharan Africa
SSF
false
2
1
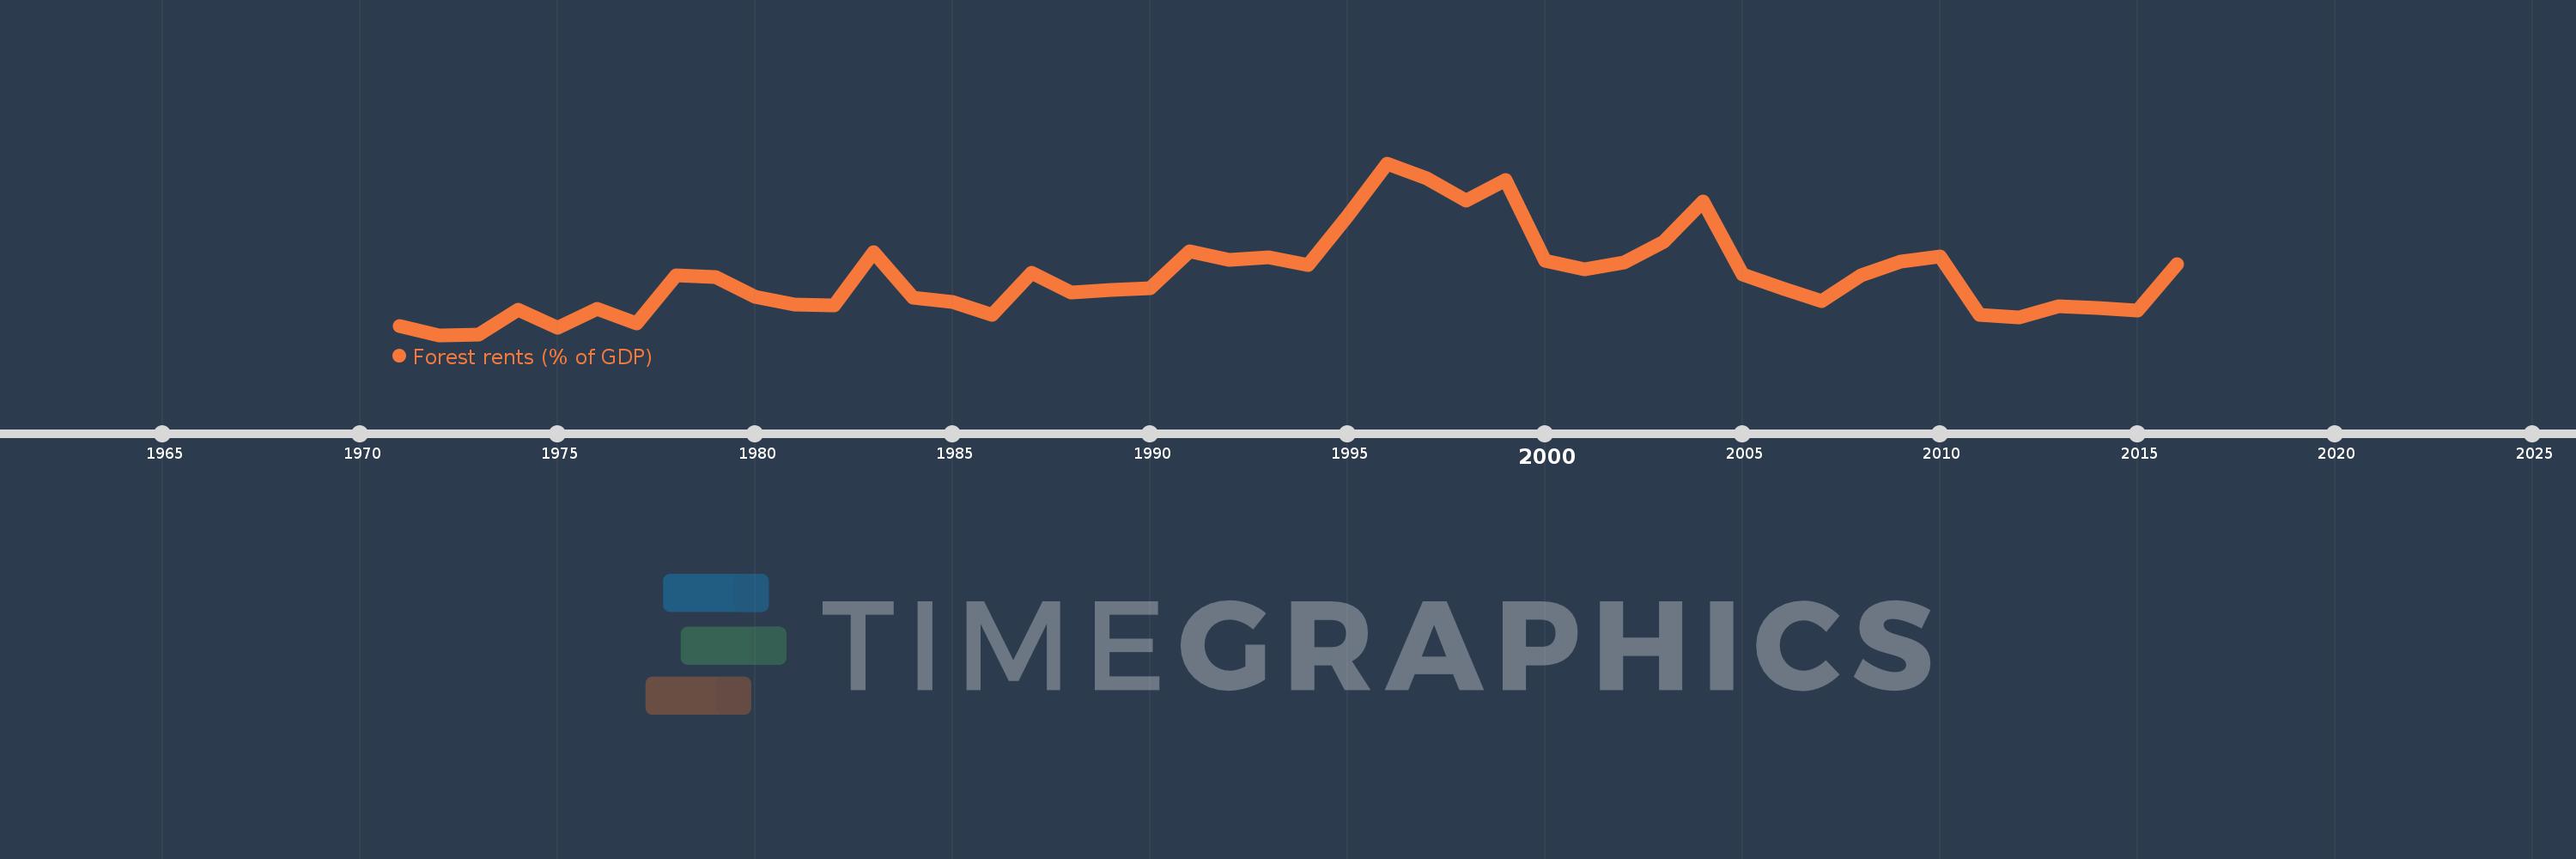
Forest rents (% of GDP)
2016,2015,2014,2013,2012,2011,2010,2009,2008,2007,2006,2005,2004,2003,2002,2001,2000,1999,1998,1997,1996,1995,1994,1993,1992,1991,1990,1989,1988,1987,1986,1985,1984,1983,1982,1981,1980,1979,1978,1977,1976,1975,1974,1973,1972,1971
This statistics in other country:
AfghanistanAlbaniaAlgeriaAndorraAngolaArab WorldArgentinaArmeniaArubaAustraliaAustriaAzerbaijanBahamas, TheBahrainBangladeshBarbadosBelarusBelgiumBelizeBeninBhutanBoliviaBosnia and HerzegovinaBotswanaBrazilBrunei DarussalamBulgariaBurkina FasoBurundiCabo VerdeCambodiaCameroonCanadaCaribbean small statesCentral African RepublicCentral Europe and the BalticsChadChileChinaColombiaComorosCongo, Dem. Rep.Congo, Rep.Costa RicaCote d'IvoireCroatiaCubaCyprusCzech RepublicDenmarkDjiboutiDominicaDominican RepublicEarly-demographic dividendEast Asia & PacificEast Asia & Pacific (excluding high income)East Asia & Pacific (IDA & IBRD countries)EcuadorEgypt, Arab Rep.El SalvadorEquatorial GuineaEritreaEstoniaEthiopiaEuro areaEurope & Central AsiaEurope & Central Asia (excluding high income)Europe & Central Asia (IDA & IBRD countries)European UnionFaroe IslandsFijiFinlandFragile and conflict affected situationsFranceFrench PolynesiaGabonGambia, TheGeorgiaGermanyGhanaGreeceGuatemalaGuineaGuinea-BissauGuyanaHaitiHeavily indebted poor countries (HIPC)High incomeHondurasHong Kong SAR, ChinaHungaryIBRD onlyIcelandIDA & IBRD totalIDA blendIDA onlyIDA totalIndiaIndonesiaIran, Islamic Rep.IraqIrelandIsraelItalyJamaicaJapanJordanKazakhstanKenyaKiribatiKorea, Rep.KuwaitKyrgyz RepublicLao PDRLate-demographic dividendLatin America & Caribbean Latin America & Caribbean (excluding high income)Latin America & the Caribbean (IDA & IBRD countries)LatviaLeast developed countries: UN classificationLebanonLesothoLiberiaLibyaLiechtensteinLithuaniaLow & middle incomeLow incomeLower middle incomeLuxembourgMacao SAR, ChinaMacedonia, FYRMadagascarMalawiMalaysiaMaldivesMaliMaltaMauritaniaMauritiusMexicoMicronesia, Fed. Sts.Middle East & North AfricaMiddle East & North Africa (excluding high income)Middle East & North Africa (IDA & IBRD countries)Middle incomeMoldovaMongoliaMontenegroMoroccoMozambiqueMyanmarNamibiaNepalNetherlandsNew CaledoniaNew ZealandNicaraguaNigerNigeriaNorth AmericaNorwayOECD membersOmanOther small statesPacific island small statesPakistanPanamaPapua New GuineaParaguayPeruPhilippinesPolandPortugalPost-demographic dividendPre-demographic dividendQatarRomaniaRussian FederationRwandaSamoaSao Tome and PrincipeSaudi ArabiaSenegalSerbiaSeychellesSierra LeoneSingaporeSlovak RepublicSloveniaSmall statesSolomon IslandsSomaliaSouth AfricaSouth AsiaSouth Asia (IDA & IBRD)South SudanSpainSri LankaSt. LuciaSt. Vincent and the GrenadinesSub-Saharan Africa Sub-Saharan Africa (excluding high income)Sub-Saharan Africa (IDA & IBRD countries)SudanSurinameSwazilandSwedenSwitzerlandSyrian Arab RepublicTajikistanTanzaniaThailandTimor-LesteTogoTongaTrinidad and TobagoTunisiaTurkeyTurkmenistanUgandaUkraineUnited Arab EmiratesUnited KingdomUnited StatesUpper middle incomeUruguayUzbekistanVanuatuVenezuela, RBVietnamWorldYemen, Rep.ZambiaZimbabwe Timeline:
This timeline shows a graph from 1971 to 2016 of Sub-Saharan Africa . No data until 1970. Number of actual observations by date: 46.
Source name:
World Development Indicators
Source organization:
Estimates based on sources and methods described in "The Changing Wealth of Nations: Measuring Sustainable Development in the New Millennium" (World Bank, 2011).
Categories, topics:
Environment
Last updated:
apr 23, 2017
Indicators value changes by year
At the date of observation
Value
Absolute change
Change from previous value
jan 1, 1971
2.233
+2.233
0.0%
jan 1, 1972
2.051
-0.182
-8.16%
jan 1, 1973
2.067
+0.016
0.79%
jan 1, 1974
2.564
+0.496
24.0%
jan 1, 1975
2.195
-0.368
-14.37%
jan 1, 1976
2.59
+0.394
17.97%
jan 1, 1977
2.282
-0.308
-11.88%
jan 1, 1978
3.282
+1.0
43.8%
jan 1, 1979
3.236
-0.045
-1.38%
jan 1, 1980
2.844
-0.392
-12.12%
jan 1, 1981
2.682
-0.163
-5.72%
jan 1, 1982
2.655
-0.027
-1.0%
jan 1, 1983
3.751
+1.096
41.28%
jan 1, 1984
2.816
-0.935
-24.92%
jan 1, 1985
2.737
-0.079
-2.8%
jan 1, 1986
2.462
-0.275
-10.04%
jan 1, 1987
3.34
+0.877
35.62%
jan 1, 1988
2.928
-0.412
-12.33%
jan 1, 1989
2.975
+0.048
1.62%
jan 1, 1990
3.019
+0.043
1.46%
jan 1, 1991
3.765
+0.746
24.72%
jan 1, 1992
3.59
-0.175
-4.64%
jan 1, 1993
3.643
+0.053
1.47%
jan 1, 1994
3.485
-0.158
-4.32%
jan 1, 1995
4.496
+1.01
28.99%
jan 1, 1996
5.585
+1.09
24.24%
jan 1, 1997
5.281
-0.304
-5.45%
jan 1, 1998
4.815
-0.466
-8.83%
jan 1, 1999
5.241
+0.426
8.86%
jan 1, 2000
3.588
-1.653
-31.55%
jan 1, 2001
3.398
-0.189
-5.28%
jan 1, 2002
3.537
+0.138
4.07%
jan 1, 2003
3.974
+0.438
12.38%
jan 1, 2004
4.791
+0.816
20.54%
jan 1, 2005
3.288
-1.503
-31.37%
jan 1, 2006
3.006
-0.282
-8.58%
jan 1, 2007
2.746
-0.26
-8.65%
jan 1, 2008
3.281
+0.535
19.48%
jan 1, 2009
3.562
+0.281
8.56%
jan 1, 2010
3.663
+0.101
2.84%
jan 1, 2011
2.472
-1.191
-32.5%
jan 1, 2012
2.413
-0.059
-2.39%
jan 1, 2013
2.648
+0.235
9.74%
jan 1, 2014
2.608
-0.041
-1.55%
jan 1, 2015
2.551
-0.057
-2.18%
jan 1, 2016
3.504
+0.953
37.35%
Ranking of countries by current statistics by years


Comments: