29
/
en
AIzaSyAYiBZKx7MnpbEhh9jyipgxe19OcubqV5w
April 1, 2024
209303
New Zealand
NZL
true
2
1
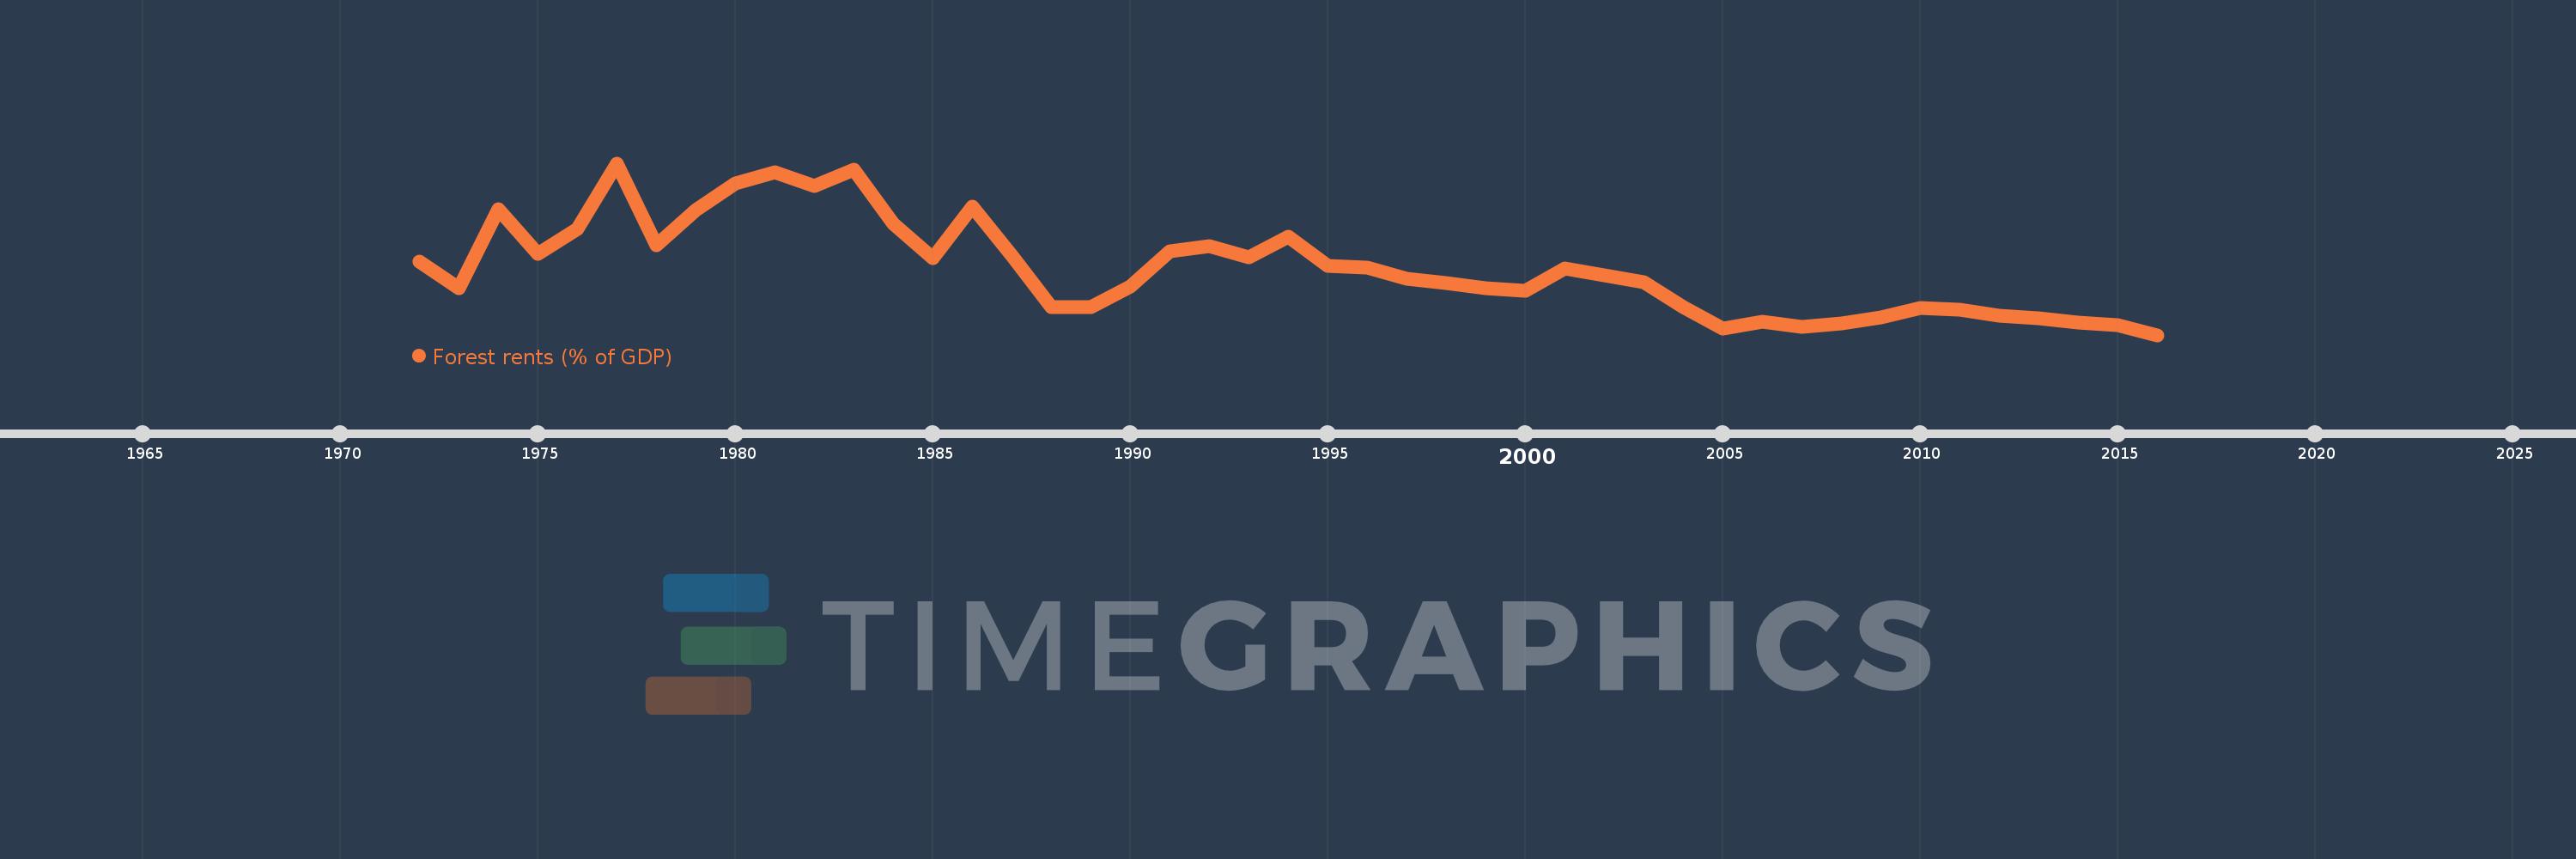
Forest rents (% of GDP)
2016,2015,2014,2013,2012,2011,2010,2009,2008,2007,2006,2005,2004,2003,2002,2001,2000,1999,1998,1997,1996,1995,1994,1993,1992,1991,1990,1989,1988,1987,1986,1985,1984,1983,1982,1981,1980,1979,1978,1977,1976,1975,1974,1973,1972
This statistics in other country:
AfghanistanAlbaniaAlgeriaAndorraAngolaArab WorldArgentinaArmeniaArubaAustraliaAustriaAzerbaijanBahamas, TheBahrainBangladeshBarbadosBelarusBelgiumBelizeBeninBhutanBoliviaBosnia and HerzegovinaBotswanaBrazilBrunei DarussalamBulgariaBurkina FasoBurundiCabo VerdeCambodiaCameroonCanadaCaribbean small statesCentral African RepublicCentral Europe and the BalticsChadChileChinaColombiaComorosCongo, Dem. Rep.Congo, Rep.Costa RicaCote d'IvoireCroatiaCubaCyprusCzech RepublicDenmarkDjiboutiDominicaDominican RepublicEarly-demographic dividendEast Asia & PacificEast Asia & Pacific (excluding high income)East Asia & Pacific (IDA & IBRD countries)EcuadorEgypt, Arab Rep.El SalvadorEquatorial GuineaEritreaEstoniaEthiopiaEuro areaEurope & Central AsiaEurope & Central Asia (excluding high income)Europe & Central Asia (IDA & IBRD countries)European UnionFaroe IslandsFijiFinlandFragile and conflict affected situationsFranceFrench PolynesiaGabonGambia, TheGeorgiaGermanyGhanaGreeceGuatemalaGuineaGuinea-BissauGuyanaHaitiHeavily indebted poor countries (HIPC)High incomeHondurasHong Kong SAR, ChinaHungaryIBRD onlyIcelandIDA & IBRD totalIDA blendIDA onlyIDA totalIndiaIndonesiaIran, Islamic Rep.IraqIrelandIsraelItalyJamaicaJapanJordanKazakhstanKenyaKiribatiKorea, Rep.KuwaitKyrgyz RepublicLao PDRLate-demographic dividendLatin America & Caribbean Latin America & Caribbean (excluding high income)Latin America & the Caribbean (IDA & IBRD countries)LatviaLeast developed countries: UN classificationLebanonLesothoLiberiaLibyaLiechtensteinLithuaniaLow & middle incomeLow incomeLower middle incomeLuxembourgMacao SAR, ChinaMacedonia, FYRMadagascarMalawiMalaysiaMaldivesMaliMaltaMauritaniaMauritiusMexicoMicronesia, Fed. Sts.Middle East & North AfricaMiddle East & North Africa (excluding high income)Middle East & North Africa (IDA & IBRD countries)Middle incomeMoldovaMongoliaMontenegroMoroccoMozambiqueMyanmarNamibiaNepalNetherlandsNew CaledoniaNew ZealandNicaraguaNigerNigeriaNorth AmericaNorwayOECD membersOmanOther small statesPacific island small statesPakistanPanamaPapua New GuineaParaguayPeruPhilippinesPolandPortugalPost-demographic dividendPre-demographic dividendQatarRomaniaRussian FederationRwandaSamoaSao Tome and PrincipeSaudi ArabiaSenegalSerbiaSeychellesSierra LeoneSingaporeSlovak RepublicSloveniaSmall statesSolomon IslandsSomaliaSouth AfricaSouth AsiaSouth Asia (IDA & IBRD)South SudanSpainSri LankaSt. LuciaSt. Vincent and the GrenadinesSub-Saharan Africa Sub-Saharan Africa (excluding high income)Sub-Saharan Africa (IDA & IBRD countries)SudanSurinameSwazilandSwedenSwitzerlandSyrian Arab RepublicTajikistanTanzaniaThailandTimor-LesteTogoTongaTrinidad and TobagoTunisiaTurkeyTurkmenistanUgandaUkraineUnited Arab EmiratesUnited KingdomUnited StatesUpper middle incomeUruguayUzbekistanVanuatuVenezuela, RBVietnamWorldYemen, Rep.ZambiaZimbabwe Timeline:
This timeline shows a graph from 1972 to 2016 of New Zealand. No data until 1971. Number of actual observations by date: 45.
Source name:
World Development Indicators
Source organization:
Estimates based on sources and methods described in "The Changing Wealth of Nations: Measuring Sustainable Development in the New Millennium" (World Bank, 2011).
Categories, topics:
Environment
Last updated:
apr 23, 2017
Indicators value changes by year
At the date of observation
Value
Absolute change
Change from previous value
jan 1, 1972
1.018
+1.018
0.0%
jan 1, 1973
0.792
-0.226
-22.22%
jan 1, 1974
1.466
+0.674
85.11%
jan 1, 1975
1.085
-0.381
-26.01%
jan 1, 1976
1.3
+0.215
19.81%
jan 1, 1977
1.865
+0.566
43.52%
jan 1, 1978
1.161
-0.704
-37.76%
jan 1, 1979
1.464
+0.303
26.05%
jan 1, 1980
1.691
+0.228
15.55%
jan 1, 1981
1.791
+0.1
5.94%
jan 1, 1982
1.671
-0.121
-6.74%
jan 1, 1983
1.807
+0.136
8.16%
jan 1, 1984
1.344
-0.464
-25.65%
jan 1, 1985
1.047
-0.296
-22.06%
jan 1, 1986
1.488
+0.441
42.1%
jan 1, 1987
1.07
-0.418
-28.11%
jan 1, 1988
0.626
-0.444
-41.49%
jan 1, 1989
0.627
+0.001
0.11%
jan 1, 1990
0.804
+0.177
28.23%
jan 1, 1991
1.11
+0.306
38.06%
jan 1, 1992
1.154
+0.044
3.98%
jan 1, 1993
1.056
-0.098
-8.46%
jan 1, 1994
1.236
+0.18
17.01%
jan 1, 1995
0.98
-0.256
-20.7%
jan 1, 1996
0.965
-0.014
-1.47%
jan 1, 1997
0.869
-0.096
-9.97%
jan 1, 1998
0.83
-0.039
-4.49%
jan 1, 1999
0.787
-0.043
-5.14%
jan 1, 2000
0.765
-0.022
-2.8%
jan 1, 2001
0.957
+0.192
25.09%
jan 1, 2002
0.903
-0.055
-5.73%
jan 1, 2003
0.841
-0.062
-6.83%
jan 1, 2004
0.625
-0.216
-25.67%
jan 1, 2005
0.443
-0.182
-29.09%
jan 1, 2006
0.498
+0.054
12.26%
jan 1, 2007
0.459
-0.039
-7.8%
jan 1, 2008
0.485
+0.026
5.65%
jan 1, 2009
0.541
+0.057
11.68%
jan 1, 2010
0.622
+0.081
14.95%
jan 1, 2011
0.601
-0.022
-3.47%
jan 1, 2012
0.549
-0.052
-8.68%
jan 1, 2013
0.531
-0.018
-3.25%
jan 1, 2014
0.491
-0.039
-7.44%
jan 1, 2015
0.472
-0.02
-3.99%
jan 1, 2016
0.386
-0.086
-18.22%
Ranking of countries by current statistics by years


Comments: