29
/
en
AIzaSyAYiBZKx7MnpbEhh9jyipgxe19OcubqV5w
April 1, 2024
254112
Suriname
SUR
true
2
1
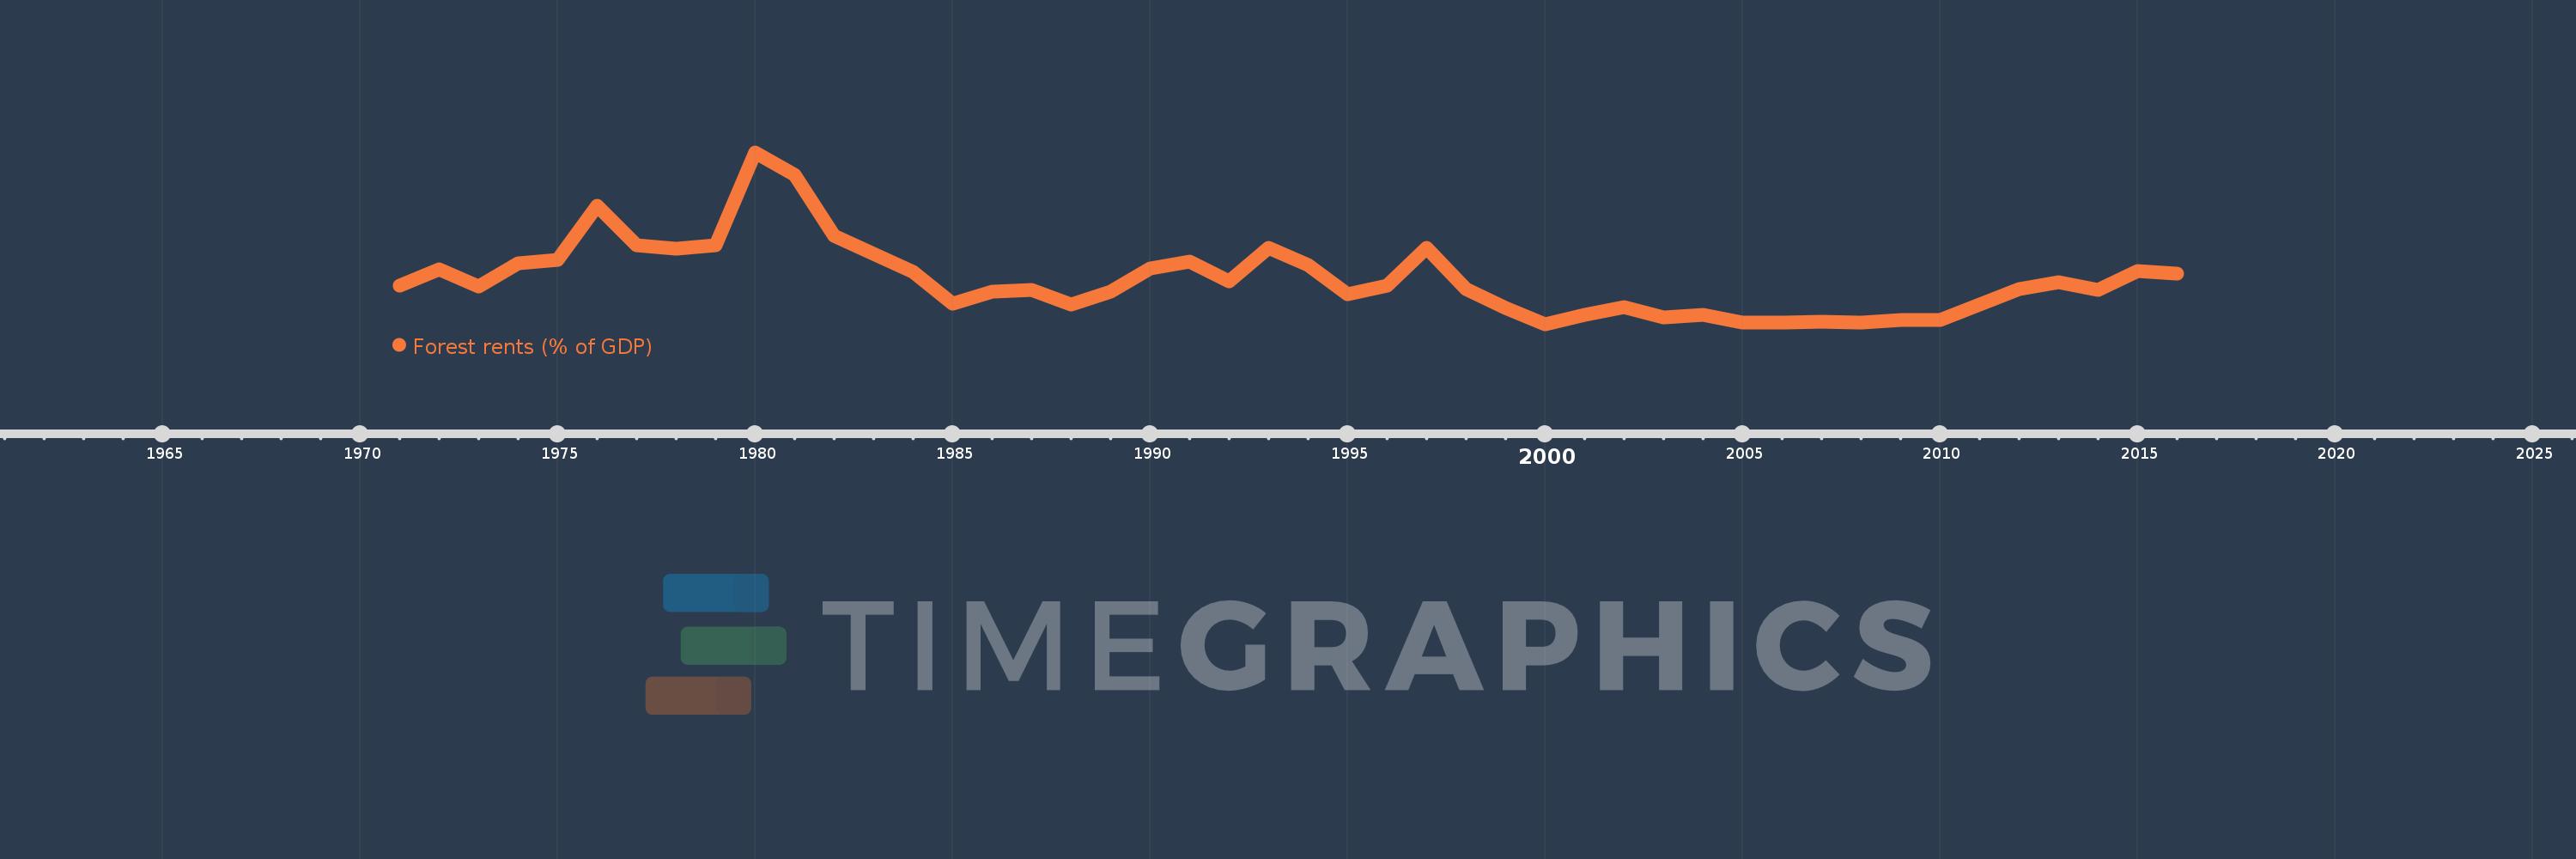
Forest rents (% of GDP)
2016,2015,2014,2013,2012,2011,2010,2009,2008,2007,2006,2005,2004,2003,2002,2001,2000,1999,1998,1997,1996,1995,1994,1993,1992,1991,1990,1989,1988,1987,1986,1985,1984,1983,1982,1981,1980,1979,1978,1977,1976,1975,1974,1973,1972,1971
This statistics in other country:
AfghanistanAlbaniaAlgeriaAndorraAngolaArab WorldArgentinaArmeniaArubaAustraliaAustriaAzerbaijanBahamas, TheBahrainBangladeshBarbadosBelarusBelgiumBelizeBeninBhutanBoliviaBosnia and HerzegovinaBotswanaBrazilBrunei DarussalamBulgariaBurkina FasoBurundiCabo VerdeCambodiaCameroonCanadaCaribbean small statesCentral African RepublicCentral Europe and the BalticsChadChileChinaColombiaComorosCongo, Dem. Rep.Congo, Rep.Costa RicaCote d'IvoireCroatiaCubaCyprusCzech RepublicDenmarkDjiboutiDominicaDominican RepublicEarly-demographic dividendEast Asia & PacificEast Asia & Pacific (excluding high income)East Asia & Pacific (IDA & IBRD countries)EcuadorEgypt, Arab Rep.El SalvadorEquatorial GuineaEritreaEstoniaEthiopiaEuro areaEurope & Central AsiaEurope & Central Asia (excluding high income)Europe & Central Asia (IDA & IBRD countries)European UnionFaroe IslandsFijiFinlandFragile and conflict affected situationsFranceFrench PolynesiaGabonGambia, TheGeorgiaGermanyGhanaGreeceGuatemalaGuineaGuinea-BissauGuyanaHaitiHeavily indebted poor countries (HIPC)High incomeHondurasHong Kong SAR, ChinaHungaryIBRD onlyIcelandIDA & IBRD totalIDA blendIDA onlyIDA totalIndiaIndonesiaIran, Islamic Rep.IraqIrelandIsraelItalyJamaicaJapanJordanKazakhstanKenyaKiribatiKorea, Rep.KuwaitKyrgyz RepublicLao PDRLate-demographic dividendLatin America & Caribbean Latin America & Caribbean (excluding high income)Latin America & the Caribbean (IDA & IBRD countries)LatviaLeast developed countries: UN classificationLebanonLesothoLiberiaLibyaLiechtensteinLithuaniaLow & middle incomeLow incomeLower middle incomeLuxembourgMacao SAR, ChinaMacedonia, FYRMadagascarMalawiMalaysiaMaldivesMaliMaltaMauritaniaMauritiusMexicoMicronesia, Fed. Sts.Middle East & North AfricaMiddle East & North Africa (excluding high income)Middle East & North Africa (IDA & IBRD countries)Middle incomeMoldovaMongoliaMontenegroMoroccoMozambiqueMyanmarNamibiaNepalNetherlandsNew CaledoniaNew ZealandNicaraguaNigerNigeriaNorth AmericaNorwayOECD membersOmanOther small statesPacific island small statesPakistanPanamaPapua New GuineaParaguayPeruPhilippinesPolandPortugalPost-demographic dividendPre-demographic dividendQatarRomaniaRussian FederationRwandaSamoaSao Tome and PrincipeSaudi ArabiaSenegalSerbiaSeychellesSierra LeoneSingaporeSlovak RepublicSloveniaSmall statesSolomon IslandsSomaliaSouth AfricaSouth AsiaSouth Asia (IDA & IBRD)South SudanSpainSri LankaSt. LuciaSt. Vincent and the GrenadinesSub-Saharan Africa Sub-Saharan Africa (excluding high income)Sub-Saharan Africa (IDA & IBRD countries)SudanSurinameSwazilandSwedenSwitzerlandSyrian Arab RepublicTajikistanTanzaniaThailandTimor-LesteTogoTongaTrinidad and TobagoTunisiaTurkeyTurkmenistanUgandaUkraineUnited Arab EmiratesUnited KingdomUnited StatesUpper middle incomeUruguayUzbekistanVanuatuVenezuela, RBVietnamWorldYemen, Rep.ZambiaZimbabwe Timeline:
This timeline shows a graph from 1971 to 2016 of Suriname. No data until 1970. Number of actual observations by date: 46.
Source name:
World Development Indicators
Source organization:
Estimates based on sources and methods described in "The Changing Wealth of Nations: Measuring Sustainable Development in the New Millennium" (World Bank, 2011).
Categories, topics:
Environment
Last updated:
apr 23, 2017
Indicators value changes by year
At the date of observation
Value
Absolute change
Change from previous value
jan 1, 1971
0.703
+0.703
0.0%
jan 1, 1972
0.863
+0.16
22.81%
jan 1, 1973
0.694
-0.169
-19.55%
jan 1, 1974
0.924
+0.23
33.13%
jan 1, 1975
0.965
+0.04
4.37%
jan 1, 1976
1.505
+0.54
56.02%
jan 1, 1977
1.108
-0.397
-26.36%
jan 1, 1978
1.077
-0.031
-2.84%
jan 1, 1979
1.109
+0.032
2.97%
jan 1, 1980
2.034
+0.925
83.41%
jan 1, 1981
1.806
-0.227
-11.18%
jan 1, 1982
1.198
-0.609
-33.7%
jan 1, 1983
1.019
-0.179
-14.94%
jan 1, 1984
0.844
-0.174
-17.13%
jan 1, 1985
0.522
-0.322
-38.14%
jan 1, 1986
0.647
+0.125
23.92%
jan 1, 1987
0.663
+0.016
2.45%
jan 1, 1988
0.519
-0.144
-21.74%
jan 1, 1989
0.642
+0.123
23.71%
jan 1, 1990
0.878
+0.236
36.75%
jan 1, 1991
0.948
+0.07
7.99%
jan 1, 1992
0.743
-0.205
-21.58%
jan 1, 1993
1.082
+0.339
45.56%
jan 1, 1994
0.907
-0.175
-16.19%
jan 1, 1995
0.615
-0.292
-32.2%
jan 1, 1996
0.702
+0.088
14.26%
jan 1, 1997
1.082
+0.38
54.05%
jan 1, 1998
0.671
-0.411
-38.0%
jan 1, 1999
0.477
-0.194
-28.9%
jan 1, 2000
0.319
-0.158
-33.13%
jan 1, 2001
0.41
+0.091
28.55%
jan 1, 2002
0.487
+0.077
18.85%
jan 1, 2003
0.389
-0.098
-20.21%
jan 1, 2004
0.413
+0.024
6.24%
jan 1, 2005
0.337
-0.076
-18.34%
jan 1, 2006
0.332
-0.005
-1.57%
jan 1, 2007
0.344
+0.012
3.73%
jan 1, 2008
0.337
-0.008
-2.22%
jan 1, 2009
0.365
+0.028
8.34%
jan 1, 2010
0.363
-0.002
-0.52%
jan 1, 2011
0.512
+0.149
41.15%
jan 1, 2012
0.668
+0.155
30.3%
jan 1, 2013
0.741
+0.074
11.04%
jan 1, 2014
0.663
-0.078
-10.57%
jan 1, 2015
0.85
+0.187
28.2%
jan 1, 2016
0.821
-0.028
-3.33%
Ranking of countries by current statistics by years


Comments: