29
/
en
AIzaSyAYiBZKx7MnpbEhh9jyipgxe19OcubqV5w
April 1, 2024
178846
Liberia
LBR
true
2
1
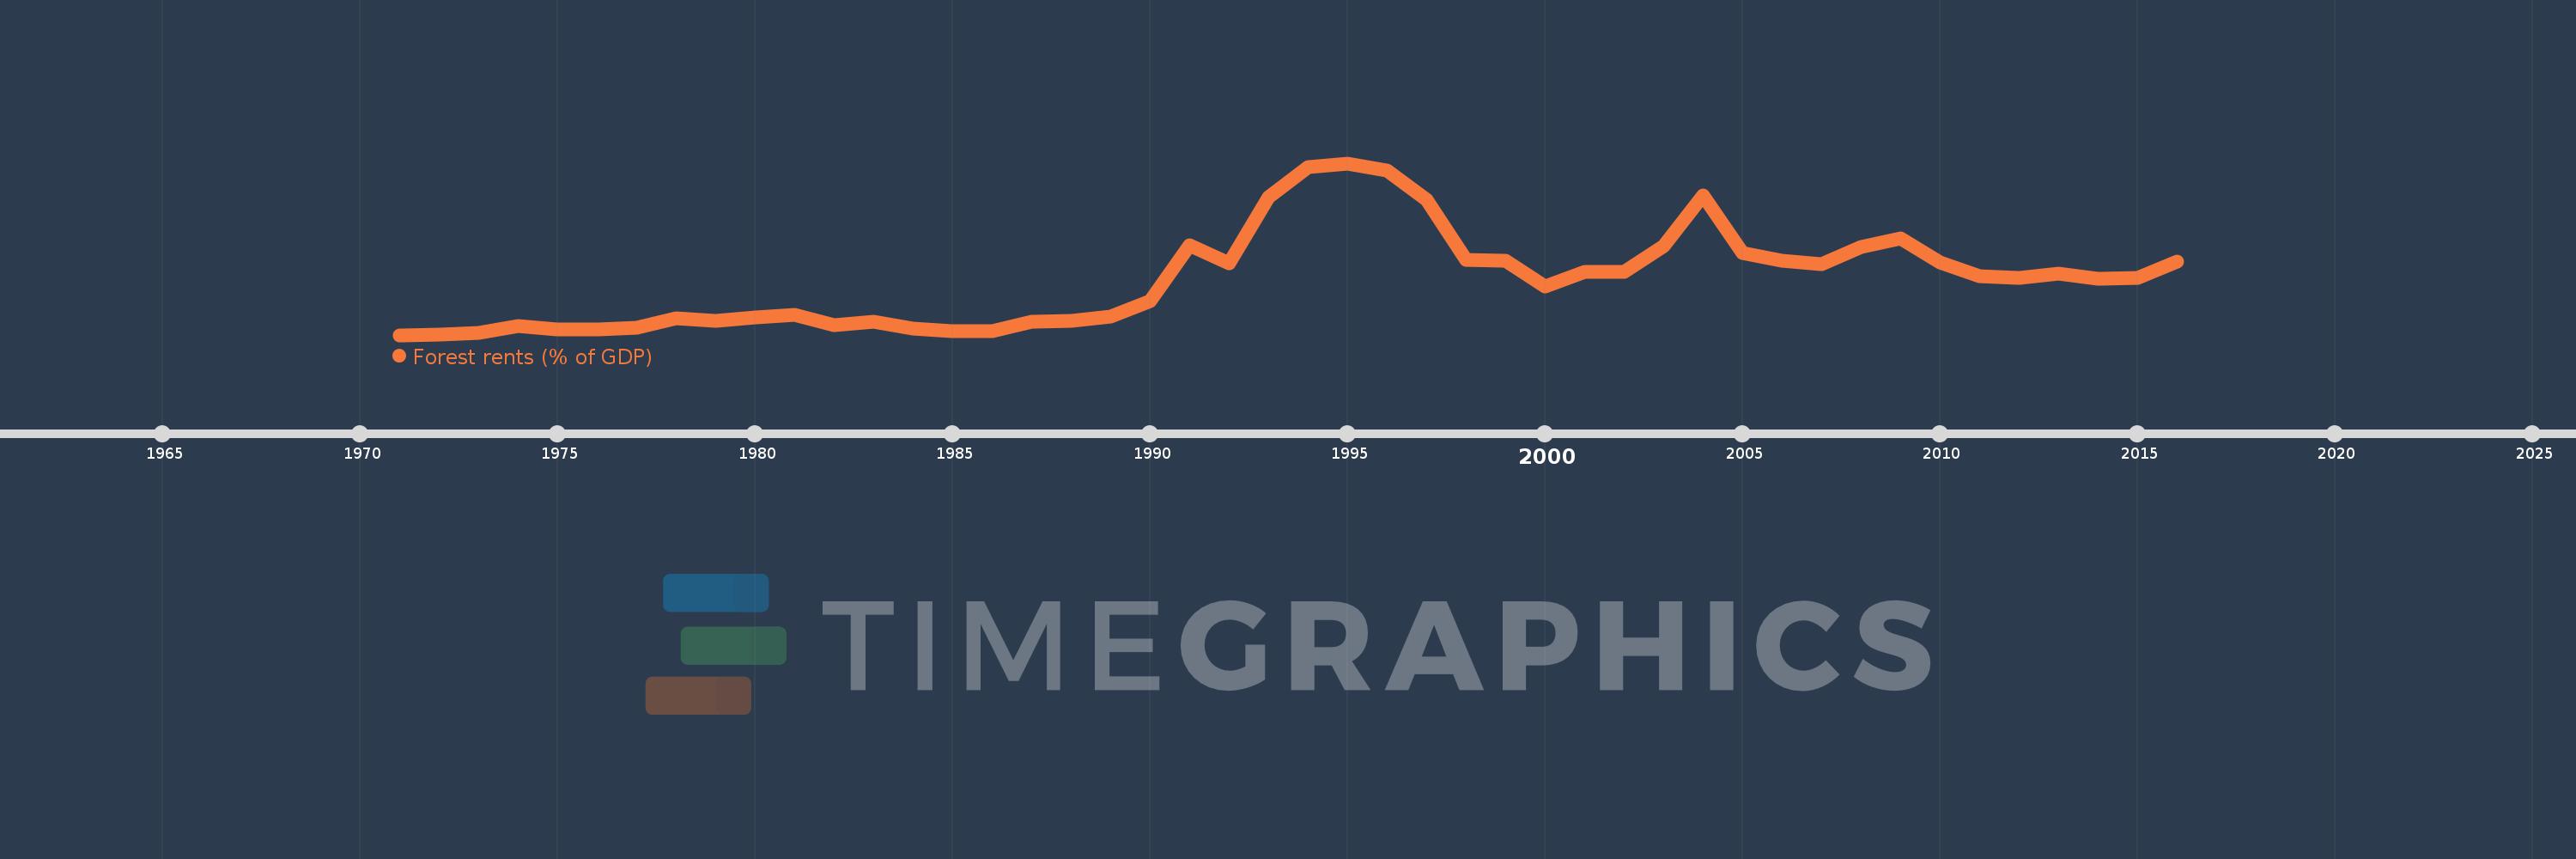
Forest rents (% of GDP)
2016,2015,2014,2013,2012,2011,2010,2009,2008,2007,2006,2005,2004,2003,2002,2001,2000,1999,1998,1997,1996,1995,1994,1993,1992,1991,1990,1989,1988,1987,1986,1985,1984,1983,1982,1981,1980,1979,1978,1977,1976,1975,1974,1973,1972,1971
This statistics in other country:
AfghanistanAlbaniaAlgeriaAndorraAngolaArab WorldArgentinaArmeniaArubaAustraliaAustriaAzerbaijanBahamas, TheBahrainBangladeshBarbadosBelarusBelgiumBelizeBeninBhutanBoliviaBosnia and HerzegovinaBotswanaBrazilBrunei DarussalamBulgariaBurkina FasoBurundiCabo VerdeCambodiaCameroonCanadaCaribbean small statesCentral African RepublicCentral Europe and the BalticsChadChileChinaColombiaComorosCongo, Dem. Rep.Congo, Rep.Costa RicaCote d'IvoireCroatiaCubaCyprusCzech RepublicDenmarkDjiboutiDominicaDominican RepublicEarly-demographic dividendEast Asia & PacificEast Asia & Pacific (excluding high income)East Asia & Pacific (IDA & IBRD countries)EcuadorEgypt, Arab Rep.El SalvadorEquatorial GuineaEritreaEstoniaEthiopiaEuro areaEurope & Central AsiaEurope & Central Asia (excluding high income)Europe & Central Asia (IDA & IBRD countries)European UnionFaroe IslandsFijiFinlandFragile and conflict affected situationsFranceFrench PolynesiaGabonGambia, TheGeorgiaGermanyGhanaGreeceGuatemalaGuineaGuinea-BissauGuyanaHaitiHeavily indebted poor countries (HIPC)High incomeHondurasHong Kong SAR, ChinaHungaryIBRD onlyIcelandIDA & IBRD totalIDA blendIDA onlyIDA totalIndiaIndonesiaIran, Islamic Rep.IraqIrelandIsraelItalyJamaicaJapanJordanKazakhstanKenyaKiribatiKorea, Rep.KuwaitKyrgyz RepublicLao PDRLate-demographic dividendLatin America & Caribbean Latin America & Caribbean (excluding high income)Latin America & the Caribbean (IDA & IBRD countries)LatviaLeast developed countries: UN classificationLebanonLesothoLiberiaLibyaLiechtensteinLithuaniaLow & middle incomeLow incomeLower middle incomeLuxembourgMacao SAR, ChinaMacedonia, FYRMadagascarMalawiMalaysiaMaldivesMaliMaltaMauritaniaMauritiusMexicoMicronesia, Fed. Sts.Middle East & North AfricaMiddle East & North Africa (excluding high income)Middle East & North Africa (IDA & IBRD countries)Middle incomeMoldovaMongoliaMontenegroMoroccoMozambiqueMyanmarNamibiaNepalNetherlandsNew CaledoniaNew ZealandNicaraguaNigerNigeriaNorth AmericaNorwayOECD membersOmanOther small statesPacific island small statesPakistanPanamaPapua New GuineaParaguayPeruPhilippinesPolandPortugalPost-demographic dividendPre-demographic dividendQatarRomaniaRussian FederationRwandaSamoaSao Tome and PrincipeSaudi ArabiaSenegalSerbiaSeychellesSierra LeoneSingaporeSlovak RepublicSloveniaSmall statesSolomon IslandsSomaliaSouth AfricaSouth AsiaSouth Asia (IDA & IBRD)South SudanSpainSri LankaSt. LuciaSt. Vincent and the GrenadinesSub-Saharan Africa Sub-Saharan Africa (excluding high income)Sub-Saharan Africa (IDA & IBRD countries)SudanSurinameSwazilandSwedenSwitzerlandSyrian Arab RepublicTajikistanTanzaniaThailandTimor-LesteTogoTongaTrinidad and TobagoTunisiaTurkeyTurkmenistanUgandaUkraineUnited Arab EmiratesUnited KingdomUnited StatesUpper middle incomeUruguayUzbekistanVanuatuVenezuela, RBVietnamWorldYemen, Rep.ZambiaZimbabwe Timeline:
This timeline shows a graph from 1971 to 2016 of Liberia. No data until 1970. Number of actual observations by date: 46.
Source name:
World Development Indicators
Source organization:
Estimates based on sources and methods described in "The Changing Wealth of Nations: Measuring Sustainable Development in the New Millennium" (World Bank, 2011).
Categories, topics:
Environment
Last updated:
apr 23, 2017
Indicators value changes by year
At the date of observation
Value
Absolute change
Change from previous value
jan 1, 1971
3.356
+3.356
0.0%
jan 1, 1972
3.455
+0.099
2.95%
jan 1, 1973
4.357
+0.902
26.1%
jan 1, 1974
7.021
+2.665
61.16%
jan 1, 1975
5.59
-1.431
-20.39%
jan 1, 1976
5.847
+0.258
4.61%
jan 1, 1977
6.43
+0.583
9.96%
jan 1, 1978
10.144
+3.714
57.75%
jan 1, 1979
9.285
-0.859
-8.47%
jan 1, 1980
10.662
+1.377
14.84%
jan 1, 1981
11.762
+1.1
10.31%
jan 1, 1982
7.394
-4.368
-37.14%
jan 1, 1983
8.731
+1.337
18.08%
jan 1, 1984
5.878
-2.853
-32.68%
jan 1, 1985
5.103
-0.775
-13.18%
jan 1, 1986
4.803
-0.299
-5.87%
jan 1, 1987
8.952
+4.148
86.37%
jan 1, 1988
9.227
+0.276
3.08%
jan 1, 1989
10.939
+1.712
18.55%
jan 1, 1990
17.533
+6.594
60.28%
jan 1, 1991
40.514
+22.982
131.08%
jan 1, 1992
33.309
-7.205
-17.78%
jan 1, 1993
60.584
+27.275
81.89%
jan 1, 1994
72.958
+12.373
20.42%
jan 1, 1995
74.73
+1.772
2.43%
jan 1, 1996
71.546
-3.184
-4.26%
jan 1, 1997
59.55
-11.996
-16.77%
jan 1, 1998
34.444
-25.106
-42.16%
jan 1, 1999
34.27
-0.174
-0.5%
jan 1, 2000
23.459
-10.811
-31.55%
jan 1, 2001
29.439
+5.98
25.49%
jan 1, 2002
29.755
+0.317
1.08%
jan 1, 2003
40.461
+10.706
35.98%
jan 1, 2004
61.504
+21.043
52.01%
jan 1, 2005
37.38
-24.124
-39.22%
jan 1, 2006
34.196
-3.184
-8.52%
jan 1, 2007
32.678
-1.518
-4.44%
jan 1, 2008
39.772
+7.094
21.71%
jan 1, 2009
43.607
+3.835
9.64%
jan 1, 2010
33.367
-10.24
-23.48%
jan 1, 2011
27.75
-5.617
-16.84%
jan 1, 2012
27.108
-0.642
-2.31%
jan 1, 2013
28.702
+1.594
5.88%
jan 1, 2014
26.892
-1.811
-6.31%
jan 1, 2015
27.041
+0.15
0.56%
jan 1, 2016
33.715
+6.674
24.68%
Ranking of countries by current statistics by years


Comments: