29
/
en
AIzaSyAYiBZKx7MnpbEhh9jyipgxe19OcubqV5w
April 1, 2024
47121
Lower middle income
LMC
false
2
1
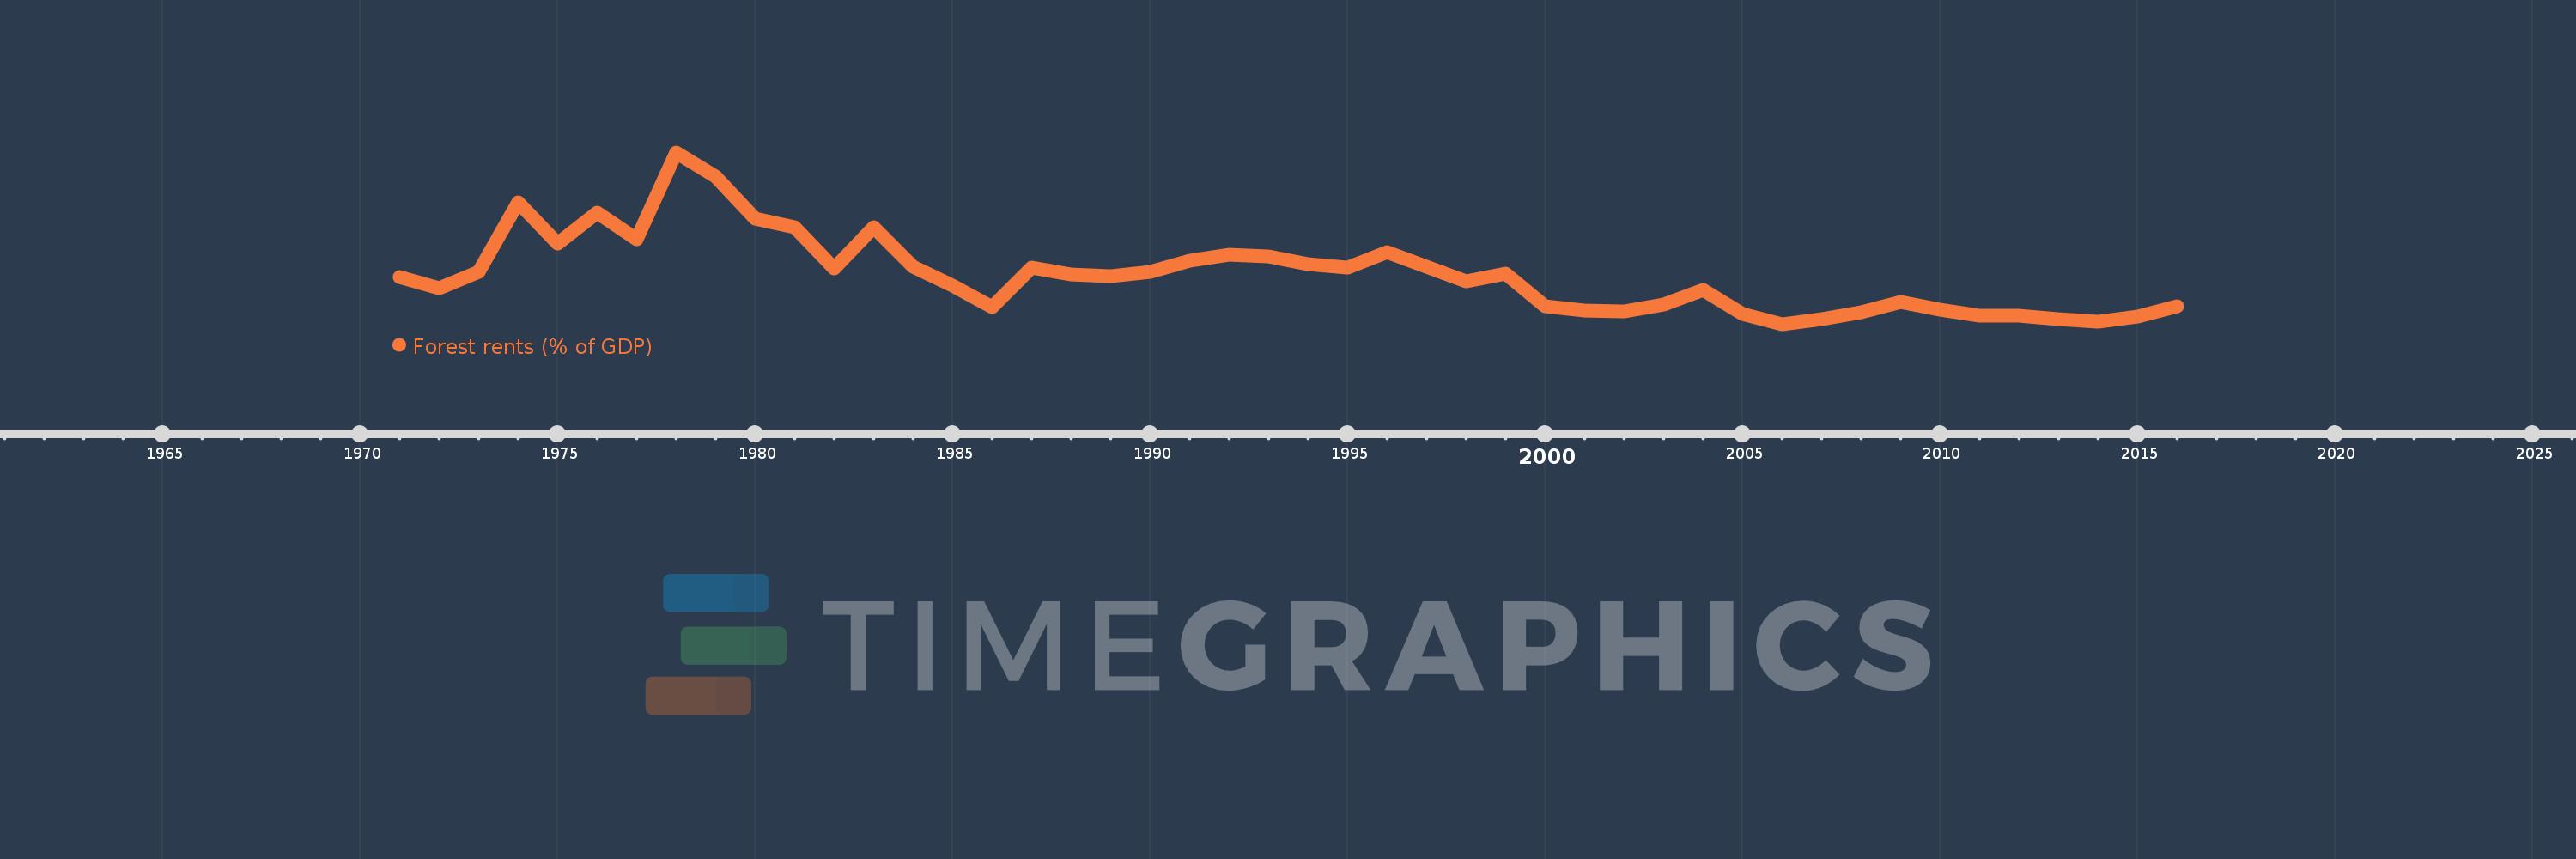
Forest rents (% of GDP)
2016,2015,2014,2013,2012,2011,2010,2009,2008,2007,2006,2005,2004,2003,2002,2001,2000,1999,1998,1997,1996,1995,1994,1993,1992,1991,1990,1989,1988,1987,1986,1985,1984,1983,1982,1981,1980,1979,1978,1977,1976,1975,1974,1973,1972,1971
This statistics in other country:
AfghanistanAlbaniaAlgeriaAndorraAngolaArab WorldArgentinaArmeniaArubaAustraliaAustriaAzerbaijanBahamas, TheBahrainBangladeshBarbadosBelarusBelgiumBelizeBeninBhutanBoliviaBosnia and HerzegovinaBotswanaBrazilBrunei DarussalamBulgariaBurkina FasoBurundiCabo VerdeCambodiaCameroonCanadaCaribbean small statesCentral African RepublicCentral Europe and the BalticsChadChileChinaColombiaComorosCongo, Dem. Rep.Congo, Rep.Costa RicaCote d'IvoireCroatiaCubaCyprusCzech RepublicDenmarkDjiboutiDominicaDominican RepublicEarly-demographic dividendEast Asia & PacificEast Asia & Pacific (excluding high income)East Asia & Pacific (IDA & IBRD countries)EcuadorEgypt, Arab Rep.El SalvadorEquatorial GuineaEritreaEstoniaEthiopiaEuro areaEurope & Central AsiaEurope & Central Asia (excluding high income)Europe & Central Asia (IDA & IBRD countries)European UnionFaroe IslandsFijiFinlandFragile and conflict affected situationsFranceFrench PolynesiaGabonGambia, TheGeorgiaGermanyGhanaGreeceGuatemalaGuineaGuinea-BissauGuyanaHaitiHeavily indebted poor countries (HIPC)High incomeHondurasHong Kong SAR, ChinaHungaryIBRD onlyIcelandIDA & IBRD totalIDA blendIDA onlyIDA totalIndiaIndonesiaIran, Islamic Rep.IraqIrelandIsraelItalyJamaicaJapanJordanKazakhstanKenyaKiribatiKorea, Rep.KuwaitKyrgyz RepublicLao PDRLate-demographic dividendLatin America & Caribbean Latin America & Caribbean (excluding high income)Latin America & the Caribbean (IDA & IBRD countries)LatviaLeast developed countries: UN classificationLebanonLesothoLiberiaLibyaLiechtensteinLithuaniaLow & middle incomeLow incomeLower middle incomeLuxembourgMacao SAR, ChinaMacedonia, FYRMadagascarMalawiMalaysiaMaldivesMaliMaltaMauritaniaMauritiusMexicoMicronesia, Fed. Sts.Middle East & North AfricaMiddle East & North Africa (excluding high income)Middle East & North Africa (IDA & IBRD countries)Middle incomeMoldovaMongoliaMontenegroMoroccoMozambiqueMyanmarNamibiaNepalNetherlandsNew CaledoniaNew ZealandNicaraguaNigerNigeriaNorth AmericaNorwayOECD membersOmanOther small statesPacific island small statesPakistanPanamaPapua New GuineaParaguayPeruPhilippinesPolandPortugalPost-demographic dividendPre-demographic dividendQatarRomaniaRussian FederationRwandaSamoaSao Tome and PrincipeSaudi ArabiaSenegalSerbiaSeychellesSierra LeoneSingaporeSlovak RepublicSloveniaSmall statesSolomon IslandsSomaliaSouth AfricaSouth AsiaSouth Asia (IDA & IBRD)South SudanSpainSri LankaSt. LuciaSt. Vincent and the GrenadinesSub-Saharan Africa Sub-Saharan Africa (excluding high income)Sub-Saharan Africa (IDA & IBRD countries)SudanSurinameSwazilandSwedenSwitzerlandSyrian Arab RepublicTajikistanTanzaniaThailandTimor-LesteTogoTongaTrinidad and TobagoTunisiaTurkeyTurkmenistanUgandaUkraineUnited Arab EmiratesUnited KingdomUnited StatesUpper middle incomeUruguayUzbekistanVanuatuVenezuela, RBVietnamWorldYemen, Rep.ZambiaZimbabwe Timeline:
This timeline shows a graph from 1971 to 2016 of Lower middle income. No data until 1970. Number of actual observations by date: 46.
Source name:
World Development Indicators
Source organization:
Estimates based on sources and methods described in "The Changing Wealth of Nations: Measuring Sustainable Development in the New Millennium" (World Bank, 2011).
Categories, topics:
Environment
Last updated:
apr 23, 2017
Indicators value changes by year
At the date of observation
Value
Absolute change
Change from previous value
jan 1, 1971
0.962
+0.962
0.0%
jan 1, 1972
0.868
-0.094
-9.75%
jan 1, 1973
1.008
+0.14
16.15%
jan 1, 1974
1.61
+0.602
59.75%
jan 1, 1975
1.257
-0.353
-21.93%
jan 1, 1976
1.521
+0.263
20.95%
jan 1, 1977
1.289
-0.232
-15.26%
jan 1, 1978
2.039
+0.751
58.25%
jan 1, 1979
1.833
-0.206
-10.1%
jan 1, 1980
1.47
-0.363
-19.83%
jan 1, 1981
1.398
-0.071
-4.86%
jan 1, 1982
1.039
-0.36
-25.74%
jan 1, 1983
1.396
+0.357
34.4%
jan 1, 1984
1.057
-0.338
-24.24%
jan 1, 1985
0.888
-0.169
-16.0%
jan 1, 1986
0.708
-0.18
-20.3%
jan 1, 1987
1.047
+0.339
47.91%
jan 1, 1988
0.989
-0.058
-5.53%
jan 1, 1989
0.975
-0.014
-1.42%
jan 1, 1990
1.012
+0.037
3.74%
jan 1, 1991
1.105
+0.093
9.24%
jan 1, 1992
1.154
+0.049
4.43%
jan 1, 1993
1.145
-0.009
-0.75%
jan 1, 1994
1.076
-0.069
-6.04%
jan 1, 1995
1.047
-0.029
-2.71%
jan 1, 1996
1.182
+0.135
12.87%
jan 1, 1997
1.056
-0.126
-10.64%
jan 1, 1998
0.927
-0.129
-12.25%
jan 1, 1999
0.998
+0.071
7.68%
jan 1, 2000
0.717
-0.281
-28.15%
jan 1, 2001
0.676
-0.041
-5.7%
jan 1, 2002
0.672
-0.004
-0.61%
jan 1, 2003
0.725
+0.053
7.91%
jan 1, 2004
0.855
+0.13
17.91%
jan 1, 2005
0.645
-0.21
-24.59%
jan 1, 2006
0.559
-0.086
-13.26%
jan 1, 2007
0.599
+0.04
7.15%
jan 1, 2008
0.663
+0.063
10.58%
jan 1, 2009
0.754
+0.092
13.83%
jan 1, 2010
0.681
-0.073
-9.71%
jan 1, 2011
0.635
-0.046
-6.77%
jan 1, 2012
0.63
-0.005
-0.72%
jan 1, 2013
0.605
-0.025
-3.96%
jan 1, 2014
0.58
-0.026
-4.23%
jan 1, 2015
0.627
+0.047
8.17%
jan 1, 2016
0.713
+0.086
13.78%
Ranking of countries by current statistics by years


Comments: