29
/
en
AIzaSyAYiBZKx7MnpbEhh9jyipgxe19OcubqV5w
April 1, 2024
29079
East Asia & Pacific (IDA & IBRD countries)
TEA
false
2
1
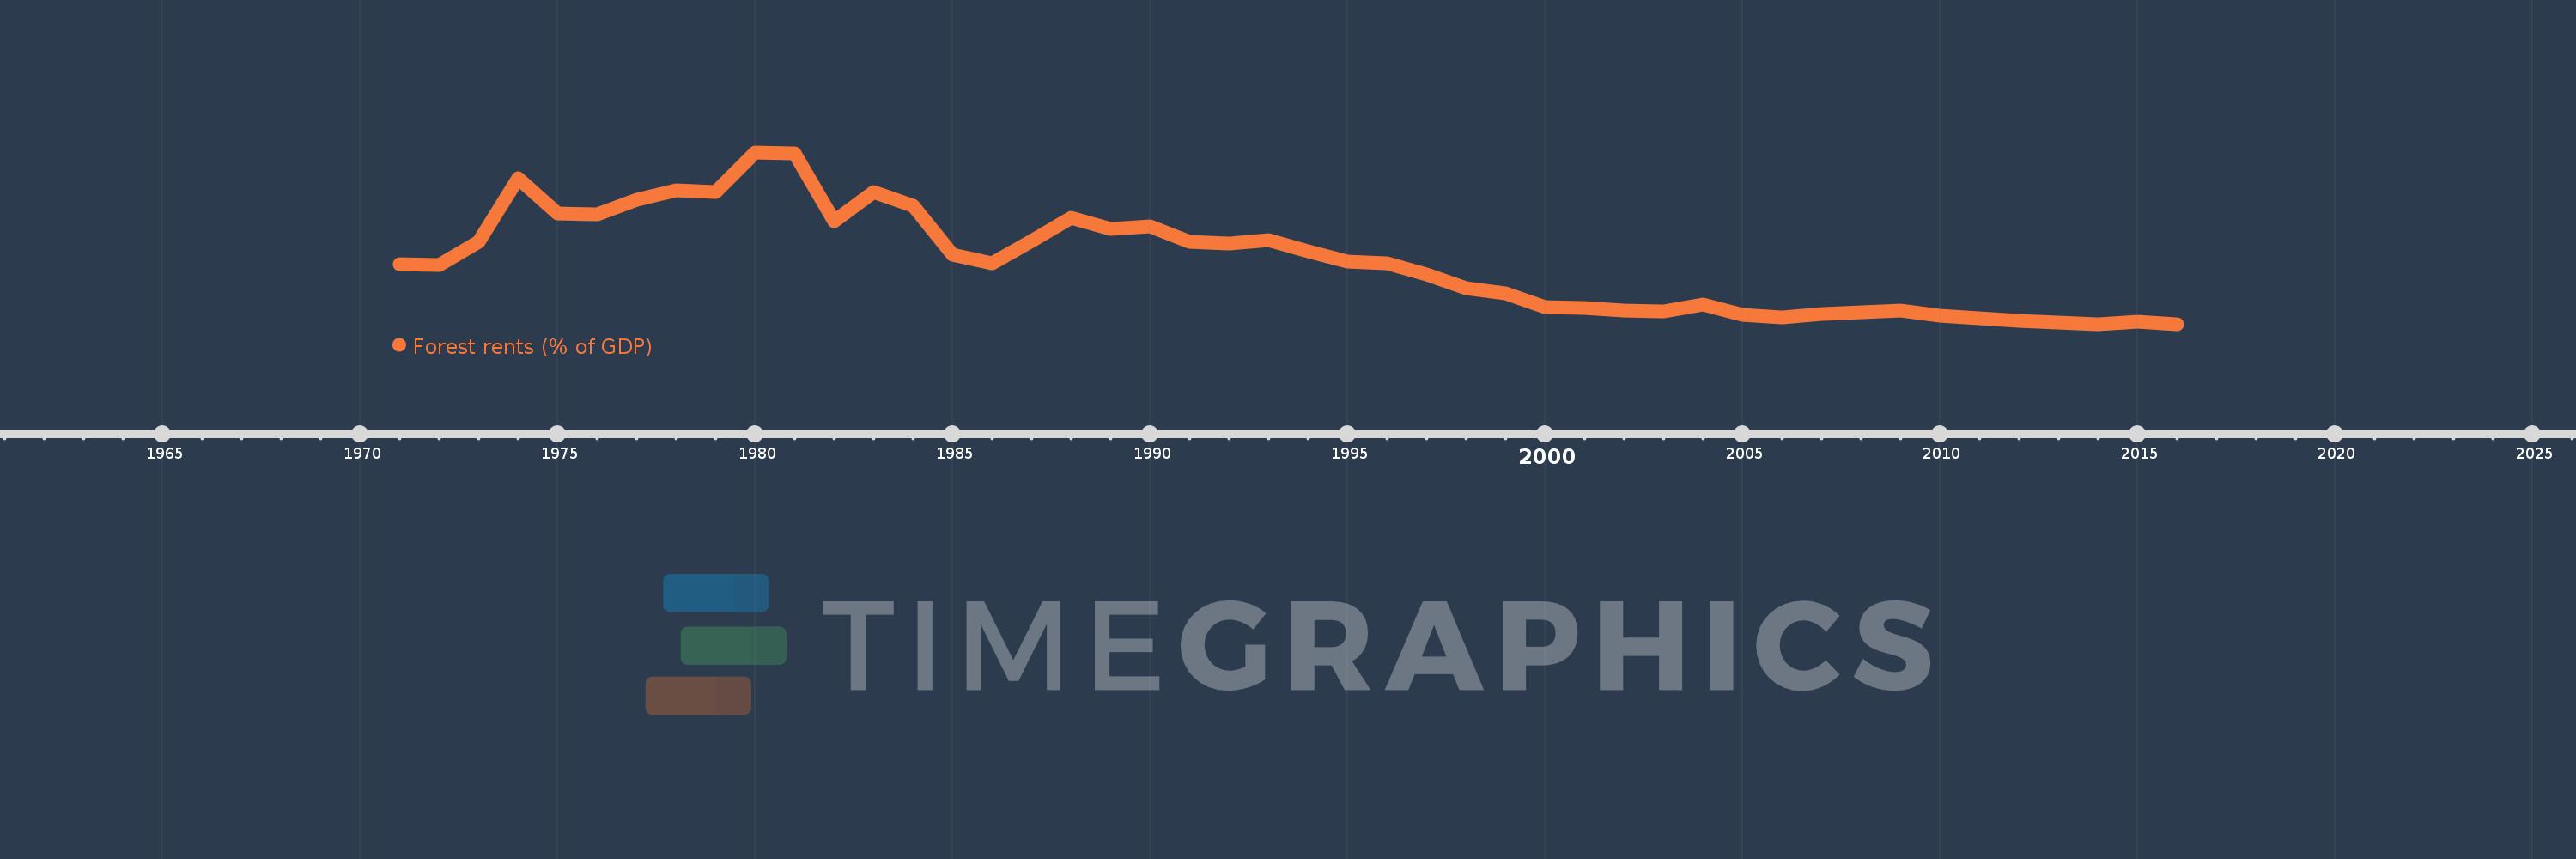
Forest rents (% of GDP)
2016,2015,2014,2013,2012,2011,2010,2009,2008,2007,2006,2005,2004,2003,2002,2001,2000,1999,1998,1997,1996,1995,1994,1993,1992,1991,1990,1989,1988,1987,1986,1985,1984,1983,1982,1981,1980,1979,1978,1977,1976,1975,1974,1973,1972,1971
This statistics in other country:
AfghanistanAlbaniaAlgeriaAndorraAngolaArab WorldArgentinaArmeniaArubaAustraliaAustriaAzerbaijanBahamas, TheBahrainBangladeshBarbadosBelarusBelgiumBelizeBeninBhutanBoliviaBosnia and HerzegovinaBotswanaBrazilBrunei DarussalamBulgariaBurkina FasoBurundiCabo VerdeCambodiaCameroonCanadaCaribbean small statesCentral African RepublicCentral Europe and the BalticsChadChileChinaColombiaComorosCongo, Dem. Rep.Congo, Rep.Costa RicaCote d'IvoireCroatiaCubaCyprusCzech RepublicDenmarkDjiboutiDominicaDominican RepublicEarly-demographic dividendEast Asia & PacificEast Asia & Pacific (excluding high income)East Asia & Pacific (IDA & IBRD countries)EcuadorEgypt, Arab Rep.El SalvadorEquatorial GuineaEritreaEstoniaEthiopiaEuro areaEurope & Central AsiaEurope & Central Asia (excluding high income)Europe & Central Asia (IDA & IBRD countries)European UnionFaroe IslandsFijiFinlandFragile and conflict affected situationsFranceFrench PolynesiaGabonGambia, TheGeorgiaGermanyGhanaGreeceGuatemalaGuineaGuinea-BissauGuyanaHaitiHeavily indebted poor countries (HIPC)High incomeHondurasHong Kong SAR, ChinaHungaryIBRD onlyIcelandIDA & IBRD totalIDA blendIDA onlyIDA totalIndiaIndonesiaIran, Islamic Rep.IraqIrelandIsraelItalyJamaicaJapanJordanKazakhstanKenyaKiribatiKorea, Rep.KuwaitKyrgyz RepublicLao PDRLate-demographic dividendLatin America & Caribbean Latin America & Caribbean (excluding high income)Latin America & the Caribbean (IDA & IBRD countries)LatviaLeast developed countries: UN classificationLebanonLesothoLiberiaLibyaLiechtensteinLithuaniaLow & middle incomeLow incomeLower middle incomeLuxembourgMacao SAR, ChinaMacedonia, FYRMadagascarMalawiMalaysiaMaldivesMaliMaltaMauritaniaMauritiusMexicoMicronesia, Fed. Sts.Middle East & North AfricaMiddle East & North Africa (excluding high income)Middle East & North Africa (IDA & IBRD countries)Middle incomeMoldovaMongoliaMontenegroMoroccoMozambiqueMyanmarNamibiaNepalNetherlandsNew CaledoniaNew ZealandNicaraguaNigerNigeriaNorth AmericaNorwayOECD membersOmanOther small statesPacific island small statesPakistanPanamaPapua New GuineaParaguayPeruPhilippinesPolandPortugalPost-demographic dividendPre-demographic dividendQatarRomaniaRussian FederationRwandaSamoaSao Tome and PrincipeSaudi ArabiaSenegalSerbiaSeychellesSierra LeoneSingaporeSlovak RepublicSloveniaSmall statesSolomon IslandsSomaliaSouth AfricaSouth AsiaSouth Asia (IDA & IBRD)South SudanSpainSri LankaSt. LuciaSt. Vincent and the GrenadinesSub-Saharan Africa Sub-Saharan Africa (excluding high income)Sub-Saharan Africa (IDA & IBRD countries)SudanSurinameSwazilandSwedenSwitzerlandSyrian Arab RepublicTajikistanTanzaniaThailandTimor-LesteTogoTongaTrinidad and TobagoTunisiaTurkeyTurkmenistanUgandaUkraineUnited Arab EmiratesUnited KingdomUnited StatesUpper middle incomeUruguayUzbekistanVanuatuVenezuela, RBVietnamWorldYemen, Rep.ZambiaZimbabwe Timeline:
This timeline shows a graph from 1971 to 2016 of East Asia & Pacific (IDA & IBRD countries). No data until 1970. Number of actual observations by date: 46.
Source name:
World Development Indicators
Source organization:
Estimates based on sources and methods described in "The Changing Wealth of Nations: Measuring Sustainable Development in the New Millennium" (World Bank, 2011).
Categories, topics:
Environment
Last updated:
apr 23, 2017
Indicators value changes by year
At the date of observation
Value
Absolute change
Change from previous value
jan 1, 1971
1.437
+1.437
0.0%
jan 1, 1972
1.418
-0.019
-1.33%
jan 1, 1973
1.869
+0.451
31.83%
jan 1, 1974
3.115
+1.246
66.67%
jan 1, 1975
2.43
-0.685
-21.99%
jan 1, 1976
2.401
-0.03
-1.22%
jan 1, 1977
2.7
+0.299
12.45%
jan 1, 1978
2.88
+0.181
6.69%
jan 1, 1979
2.842
-0.039
-1.34%
jan 1, 1980
3.626
+0.784
27.59%
jan 1, 1981
3.607
-0.019
-0.53%
jan 1, 1982
2.27
-1.337
-37.07%
jan 1, 1983
2.843
+0.574
25.27%
jan 1, 1984
2.572
-0.271
-9.53%
jan 1, 1985
1.611
-0.961
-37.37%
jan 1, 1986
1.441
-0.17
-10.53%
jan 1, 1987
1.882
+0.441
30.59%
jan 1, 1988
2.348
+0.465
24.73%
jan 1, 1989
2.121
-0.227
-9.65%
jan 1, 1990
2.171
+0.05
2.38%
jan 1, 1991
1.871
-0.301
-13.85%
jan 1, 1992
1.841
-0.03
-1.59%
jan 1, 1993
1.911
+0.07
3.79%
jan 1, 1994
1.691
-0.22
-11.49%
jan 1, 1995
1.485
-0.206
-12.18%
jan 1, 1996
1.448
-0.037
-2.47%
jan 1, 1997
1.229
-0.219
-15.15%
jan 1, 1998
0.963
-0.266
-21.63%
jan 1, 1999
0.865
-0.098
-10.14%
jan 1, 2000
0.593
-0.273
-31.52%
jan 1, 2001
0.563
-0.03
-5.06%
jan 1, 2002
0.527
-0.036
-6.41%
jan 1, 2003
0.506
-0.021
-3.93%
jan 1, 2004
0.645
+0.139
27.43%
jan 1, 2005
0.442
-0.203
-31.46%
jan 1, 2006
0.392
-0.05
-11.23%
jan 1, 2007
0.458
+0.065
16.66%
jan 1, 2008
0.484
+0.026
5.74%
jan 1, 2009
0.516
+0.033
6.73%
jan 1, 2010
0.412
-0.105
-20.29%
jan 1, 2011
0.372
-0.04
-9.65%
jan 1, 2012
0.323
-0.049
-13.17%
jan 1, 2013
0.277
-0.045
-14.08%
jan 1, 2014
0.254
-0.023
-8.36%
jan 1, 2015
0.297
+0.042
16.62%
jan 1, 2016
0.251
-0.046
-15.44%
Ranking of countries by current statistics by years


Comments: