29
/
en
AIzaSyAYiBZKx7MnpbEhh9jyipgxe19OcubqV5w
April 1, 2024
61602
Upper middle income
UMC
false
2
1
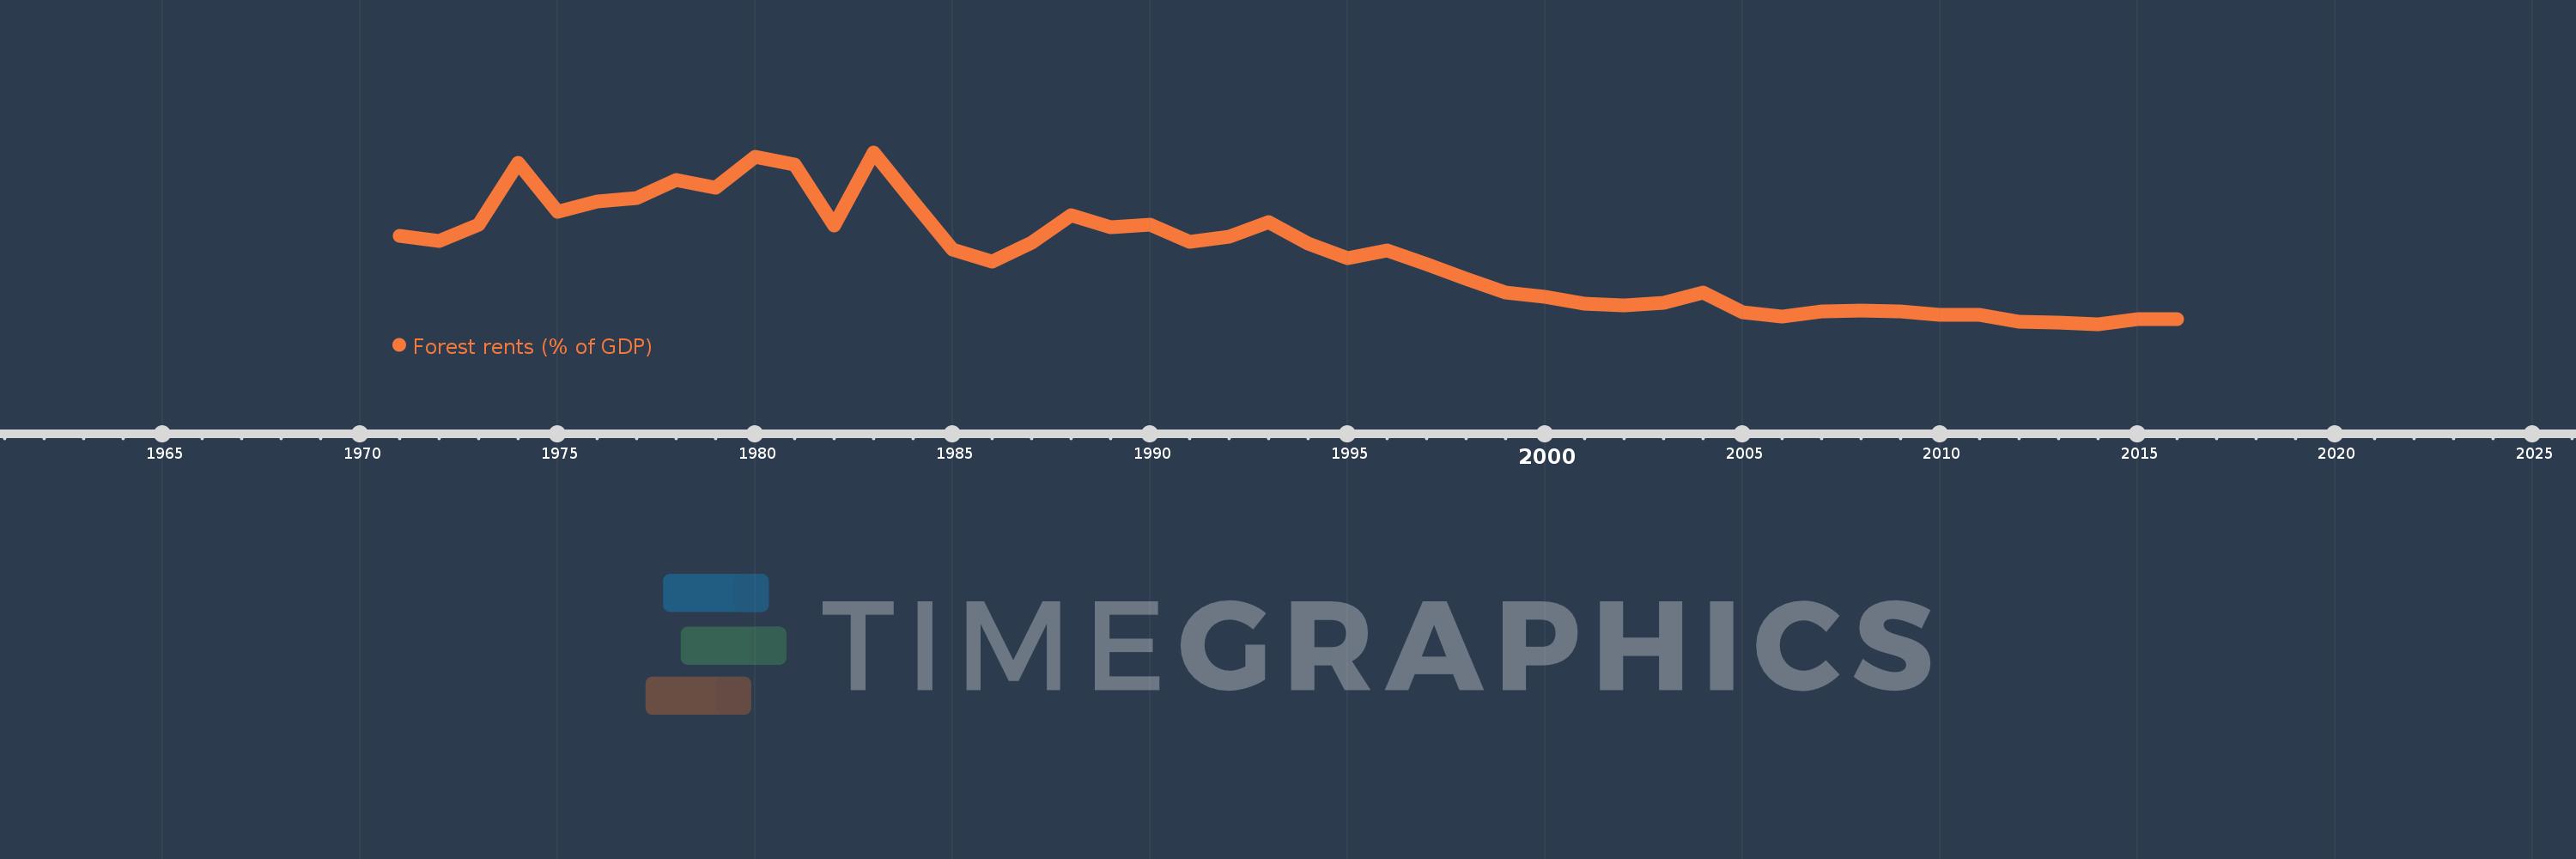
Forest rents (% of GDP)
2016,2015,2014,2013,2012,2011,2010,2009,2008,2007,2006,2005,2004,2003,2002,2001,2000,1999,1998,1997,1996,1995,1994,1993,1992,1991,1990,1989,1988,1987,1986,1985,1984,1983,1982,1981,1980,1979,1978,1977,1976,1975,1974,1973,1972,1971
This statistics in other country:
AfghanistanAlbaniaAlgeriaAndorraAngolaArab WorldArgentinaArmeniaArubaAustraliaAustriaAzerbaijanBahamas, TheBahrainBangladeshBarbadosBelarusBelgiumBelizeBeninBhutanBoliviaBosnia and HerzegovinaBotswanaBrazilBrunei DarussalamBulgariaBurkina FasoBurundiCabo VerdeCambodiaCameroonCanadaCaribbean small statesCentral African RepublicCentral Europe and the BalticsChadChileChinaColombiaComorosCongo, Dem. Rep.Congo, Rep.Costa RicaCote d'IvoireCroatiaCubaCyprusCzech RepublicDenmarkDjiboutiDominicaDominican RepublicEarly-demographic dividendEast Asia & PacificEast Asia & Pacific (excluding high income)East Asia & Pacific (IDA & IBRD countries)EcuadorEgypt, Arab Rep.El SalvadorEquatorial GuineaEritreaEstoniaEthiopiaEuro areaEurope & Central AsiaEurope & Central Asia (excluding high income)Europe & Central Asia (IDA & IBRD countries)European UnionFaroe IslandsFijiFinlandFragile and conflict affected situationsFranceFrench PolynesiaGabonGambia, TheGeorgiaGermanyGhanaGreeceGuatemalaGuineaGuinea-BissauGuyanaHaitiHeavily indebted poor countries (HIPC)High incomeHondurasHong Kong SAR, ChinaHungaryIBRD onlyIcelandIDA & IBRD totalIDA blendIDA onlyIDA totalIndiaIndonesiaIran, Islamic Rep.IraqIrelandIsraelItalyJamaicaJapanJordanKazakhstanKenyaKiribatiKorea, Rep.KuwaitKyrgyz RepublicLao PDRLate-demographic dividendLatin America & Caribbean Latin America & Caribbean (excluding high income)Latin America & the Caribbean (IDA & IBRD countries)LatviaLeast developed countries: UN classificationLebanonLesothoLiberiaLibyaLiechtensteinLithuaniaLow & middle incomeLow incomeLower middle incomeLuxembourgMacao SAR, ChinaMacedonia, FYRMadagascarMalawiMalaysiaMaldivesMaliMaltaMauritaniaMauritiusMexicoMicronesia, Fed. Sts.Middle East & North AfricaMiddle East & North Africa (excluding high income)Middle East & North Africa (IDA & IBRD countries)Middle incomeMoldovaMongoliaMontenegroMoroccoMozambiqueMyanmarNamibiaNepalNetherlandsNew CaledoniaNew ZealandNicaraguaNigerNigeriaNorth AmericaNorwayOECD membersOmanOther small statesPacific island small statesPakistanPanamaPapua New GuineaParaguayPeruPhilippinesPolandPortugalPost-demographic dividendPre-demographic dividendQatarRomaniaRussian FederationRwandaSamoaSao Tome and PrincipeSaudi ArabiaSenegalSerbiaSeychellesSierra LeoneSingaporeSlovak RepublicSloveniaSmall statesSolomon IslandsSomaliaSouth AfricaSouth AsiaSouth Asia (IDA & IBRD)South SudanSpainSri LankaSt. LuciaSt. Vincent and the GrenadinesSub-Saharan Africa Sub-Saharan Africa (excluding high income)Sub-Saharan Africa (IDA & IBRD countries)SudanSurinameSwazilandSwedenSwitzerlandSyrian Arab RepublicTajikistanTanzaniaThailandTimor-LesteTogoTongaTrinidad and TobagoTunisiaTurkeyTurkmenistanUgandaUkraineUnited Arab EmiratesUnited KingdomUnited StatesUpper middle incomeUruguayUzbekistanVanuatuVenezuela, RBVietnamWorldYemen, Rep.ZambiaZimbabwe Timeline:
This timeline shows a graph from 1971 to 2016 of Upper middle income. No data until 1970. Number of actual observations by date: 46.
Source name:
World Development Indicators
Source organization:
Estimates based on sources and methods described in "The Changing Wealth of Nations: Measuring Sustainable Development in the New Millennium" (World Bank, 2011).
Categories, topics:
Environment
Last updated:
apr 23, 2017
Indicators value changes by year
At the date of observation
Value
Absolute change
Change from previous value
jan 1, 1971
0.804
+0.804
0.0%
jan 1, 1972
0.77
-0.034
-4.23%
jan 1, 1973
0.875
+0.105
13.68%
jan 1, 1974
1.28
+0.405
46.29%
jan 1, 1975
0.958
-0.322
-25.19%
jan 1, 1976
1.024
+0.066
6.91%
jan 1, 1977
1.046
+0.022
2.17%
jan 1, 1978
1.164
+0.117
11.21%
jan 1, 1979
1.117
-0.047
-4.04%
jan 1, 1980
1.315
+0.198
17.74%
jan 1, 1981
1.265
-0.049
-3.76%
jan 1, 1982
0.868
-0.397
-31.38%
jan 1, 1983
1.345
+0.477
54.92%
jan 1, 1984
1.027
-0.318
-23.66%
jan 1, 1985
0.713
-0.313
-30.53%
jan 1, 1986
0.635
-0.079
-11.02%
jan 1, 1987
0.758
+0.124
19.49%
jan 1, 1988
0.937
+0.178
23.51%
jan 1, 1989
0.857
-0.08
-8.52%
jan 1, 1990
0.875
+0.018
2.07%
jan 1, 1991
0.763
-0.112
-12.76%
jan 1, 1992
0.794
+0.031
4.01%
jan 1, 1993
0.892
+0.098
12.35%
jan 1, 1994
0.751
-0.14
-15.71%
jan 1, 1995
0.654
-0.097
-12.96%
jan 1, 1996
0.707
+0.053
8.12%
jan 1, 1997
0.619
-0.088
-12.46%
jan 1, 1998
0.521
-0.098
-15.91%
jan 1, 1999
0.431
-0.09
-17.3%
jan 1, 2000
0.405
-0.026
-5.93%
jan 1, 2001
0.359
-0.046
-11.29%
jan 1, 2002
0.346
-0.013
-3.74%
jan 1, 2003
0.366
+0.02
5.88%
jan 1, 2004
0.432
+0.065
17.86%
jan 1, 2005
0.305
-0.127
-29.34%
jan 1, 2006
0.276
-0.029
-9.61%
jan 1, 2007
0.307
+0.031
11.3%
jan 1, 2008
0.314
+0.007
2.31%
jan 1, 2009
0.308
-0.006
-2.02%
jan 1, 2010
0.285
-0.023
-7.45%
jan 1, 2011
0.288
+0.003
1.21%
jan 1, 2012
0.245
-0.043
-14.86%
jan 1, 2013
0.235
-0.01
-4.27%
jan 1, 2014
0.226
-0.009
-3.86%
jan 1, 2015
0.259
+0.033
14.74%
jan 1, 2016
0.258
-0.001
-0.52%
Ranking of countries by current statistics by years


Comments: