29
/
en
AIzaSyAYiBZKx7MnpbEhh9jyipgxe19OcubqV5w
April 1, 2024
113572
Cote d'Ivoire
CIV
true
2
1
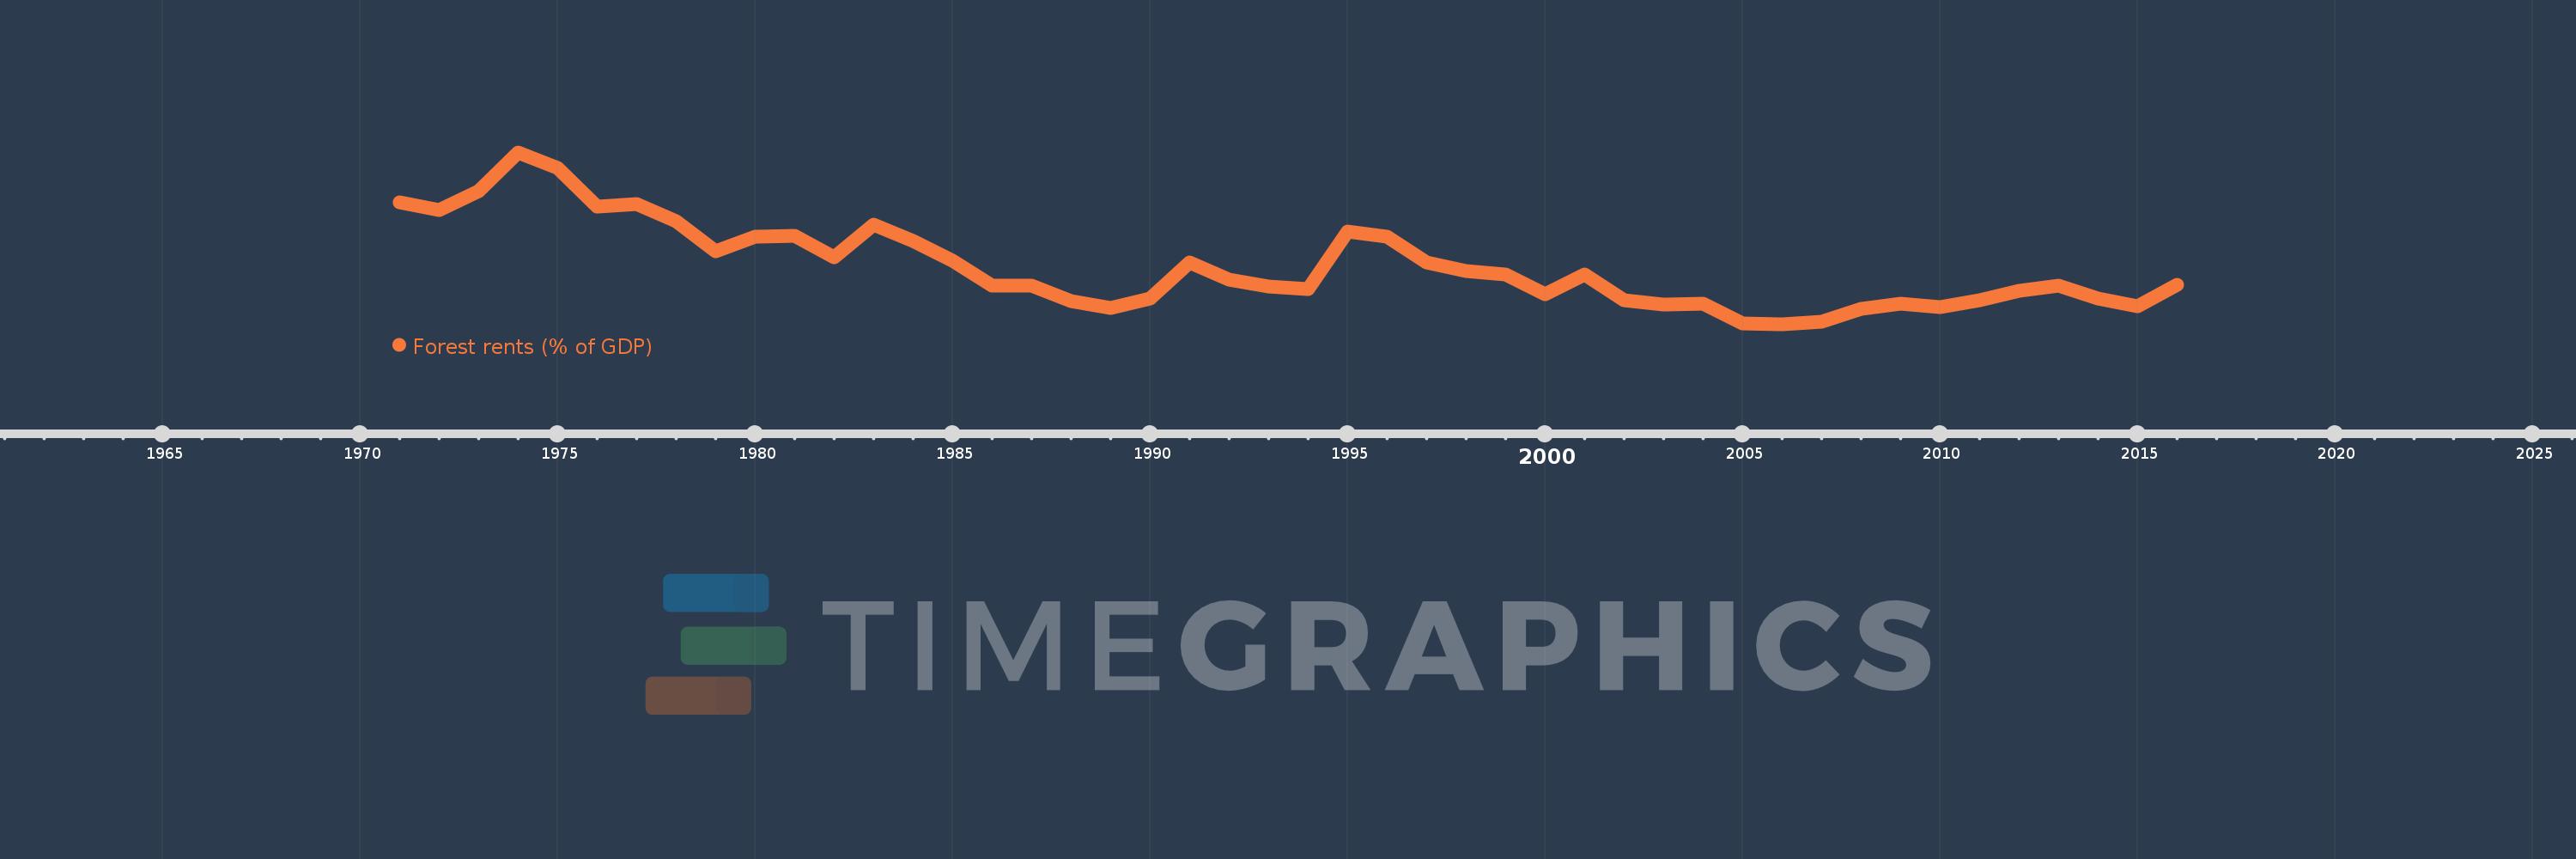
Forest rents (% of GDP)
2016,2015,2014,2013,2012,2011,2010,2009,2008,2007,2006,2005,2004,2003,2002,2001,2000,1999,1998,1997,1996,1995,1994,1993,1992,1991,1990,1989,1988,1987,1986,1985,1984,1983,1982,1981,1980,1979,1978,1977,1976,1975,1974,1973,1972,1971
This statistics in other country:
AfghanistanAlbaniaAlgeriaAndorraAngolaArab WorldArgentinaArmeniaArubaAustraliaAustriaAzerbaijanBahamas, TheBahrainBangladeshBarbadosBelarusBelgiumBelizeBeninBhutanBoliviaBosnia and HerzegovinaBotswanaBrazilBrunei DarussalamBulgariaBurkina FasoBurundiCabo VerdeCambodiaCameroonCanadaCaribbean small statesCentral African RepublicCentral Europe and the BalticsChadChileChinaColombiaComorosCongo, Dem. Rep.Congo, Rep.Costa RicaCote d'IvoireCroatiaCubaCyprusCzech RepublicDenmarkDjiboutiDominicaDominican RepublicEarly-demographic dividendEast Asia & PacificEast Asia & Pacific (excluding high income)East Asia & Pacific (IDA & IBRD countries)EcuadorEgypt, Arab Rep.El SalvadorEquatorial GuineaEritreaEstoniaEthiopiaEuro areaEurope & Central AsiaEurope & Central Asia (excluding high income)Europe & Central Asia (IDA & IBRD countries)European UnionFaroe IslandsFijiFinlandFragile and conflict affected situationsFranceFrench PolynesiaGabonGambia, TheGeorgiaGermanyGhanaGreeceGuatemalaGuineaGuinea-BissauGuyanaHaitiHeavily indebted poor countries (HIPC)High incomeHondurasHong Kong SAR, ChinaHungaryIBRD onlyIcelandIDA & IBRD totalIDA blendIDA onlyIDA totalIndiaIndonesiaIran, Islamic Rep.IraqIrelandIsraelItalyJamaicaJapanJordanKazakhstanKenyaKiribatiKorea, Rep.KuwaitKyrgyz RepublicLao PDRLate-demographic dividendLatin America & Caribbean Latin America & Caribbean (excluding high income)Latin America & the Caribbean (IDA & IBRD countries)LatviaLeast developed countries: UN classificationLebanonLesothoLiberiaLibyaLiechtensteinLithuaniaLow & middle incomeLow incomeLower middle incomeLuxembourgMacao SAR, ChinaMacedonia, FYRMadagascarMalawiMalaysiaMaldivesMaliMaltaMauritaniaMauritiusMexicoMicronesia, Fed. Sts.Middle East & North AfricaMiddle East & North Africa (excluding high income)Middle East & North Africa (IDA & IBRD countries)Middle incomeMoldovaMongoliaMontenegroMoroccoMozambiqueMyanmarNamibiaNepalNetherlandsNew CaledoniaNew ZealandNicaraguaNigerNigeriaNorth AmericaNorwayOECD membersOmanOther small statesPacific island small statesPakistanPanamaPapua New GuineaParaguayPeruPhilippinesPolandPortugalPost-demographic dividendPre-demographic dividendQatarRomaniaRussian FederationRwandaSamoaSao Tome and PrincipeSaudi ArabiaSenegalSerbiaSeychellesSierra LeoneSingaporeSlovak RepublicSloveniaSmall statesSolomon IslandsSomaliaSouth AfricaSouth AsiaSouth Asia (IDA & IBRD)South SudanSpainSri LankaSt. LuciaSt. Vincent and the GrenadinesSub-Saharan Africa Sub-Saharan Africa (excluding high income)Sub-Saharan Africa (IDA & IBRD countries)SudanSurinameSwazilandSwedenSwitzerlandSyrian Arab RepublicTajikistanTanzaniaThailandTimor-LesteTogoTongaTrinidad and TobagoTunisiaTurkeyTurkmenistanUgandaUkraineUnited Arab EmiratesUnited KingdomUnited StatesUpper middle incomeUruguayUzbekistanVanuatuVenezuela, RBVietnamWorldYemen, Rep.ZambiaZimbabwe Timeline:
This timeline shows a graph from 1971 to 2016 of Cote d'Ivoire. No data until 1970. Number of actual observations by date: 46.
Source name:
World Development Indicators
Source organization:
Estimates based on sources and methods described in "The Changing Wealth of Nations: Measuring Sustainable Development in the New Millennium" (World Bank, 2011).
Categories, topics:
Environment
Last updated:
apr 23, 2017
Indicators value changes by year
At the date of observation
Value
Absolute change
Change from previous value
jan 1, 1971
5.882
+5.882
0.0%
jan 1, 1972
5.649
-0.233
-3.96%
jan 1, 1973
6.249
+0.6
10.62%
jan 1, 1974
7.463
+1.214
19.43%
jan 1, 1975
6.977
-0.486
-6.51%
jan 1, 1976
5.74
-1.237
-17.74%
jan 1, 1977
5.842
+0.102
1.78%
jan 1, 1978
5.293
-0.549
-9.4%
jan 1, 1979
4.334
-0.958
-18.11%
jan 1, 1980
4.79
+0.455
10.51%
jan 1, 1981
4.812
+0.022
0.47%
jan 1, 1982
4.141
-0.67
-13.93%
jan 1, 1983
5.17
+1.029
24.84%
jan 1, 1984
4.651
-0.519
-10.05%
jan 1, 1985
4.028
-0.623
-13.39%
jan 1, 1986
3.248
-0.78
-19.36%
jan 1, 1987
3.237
-0.011
-0.35%
jan 1, 1988
2.757
-0.48
-14.82%
jan 1, 1989
2.529
-0.228
-8.28%
jan 1, 1990
2.833
+0.304
12.02%
jan 1, 1991
3.977
+1.144
40.39%
jan 1, 1992
3.436
-0.541
-13.6%
jan 1, 1993
3.219
-0.217
-6.33%
jan 1, 1994
3.126
-0.093
-2.88%
jan 1, 1995
4.971
+1.845
59.01%
jan 1, 1996
4.798
-0.172
-3.47%
jan 1, 1997
3.976
-0.823
-17.14%
jan 1, 1998
3.706
-0.27
-6.78%
jan 1, 1999
3.592
-0.115
-3.09%
jan 1, 2000
2.985
-0.607
-16.9%
jan 1, 2001
3.612
+0.628
21.03%
jan 1, 2002
2.784
-0.828
-22.92%
jan 1, 2003
2.639
-0.145
-5.22%
jan 1, 2004
2.679
+0.039
1.49%
jan 1, 2005
2.063
-0.615
-22.97%
jan 1, 2006
2.025
-0.039
-1.87%
jan 1, 2007
2.1
+0.075
3.69%
jan 1, 2008
2.508
+0.408
19.45%
jan 1, 2009
2.685
+0.177
7.04%
jan 1, 2010
2.563
-0.122
-4.54%
jan 1, 2011
2.777
+0.214
8.34%
jan 1, 2012
3.079
+0.303
10.9%
jan 1, 2013
3.244
+0.165
5.35%
jan 1, 2014
2.839
-0.405
-12.47%
jan 1, 2015
2.603
-0.236
-8.31%
jan 1, 2016
3.267
+0.664
25.5%
Ranking of countries by current statistics by years


Comments: