29
/
en
AIzaSyAYiBZKx7MnpbEhh9jyipgxe19OcubqV5w
April 1, 2024
279772
Vanuatu
VUT
true
2
1
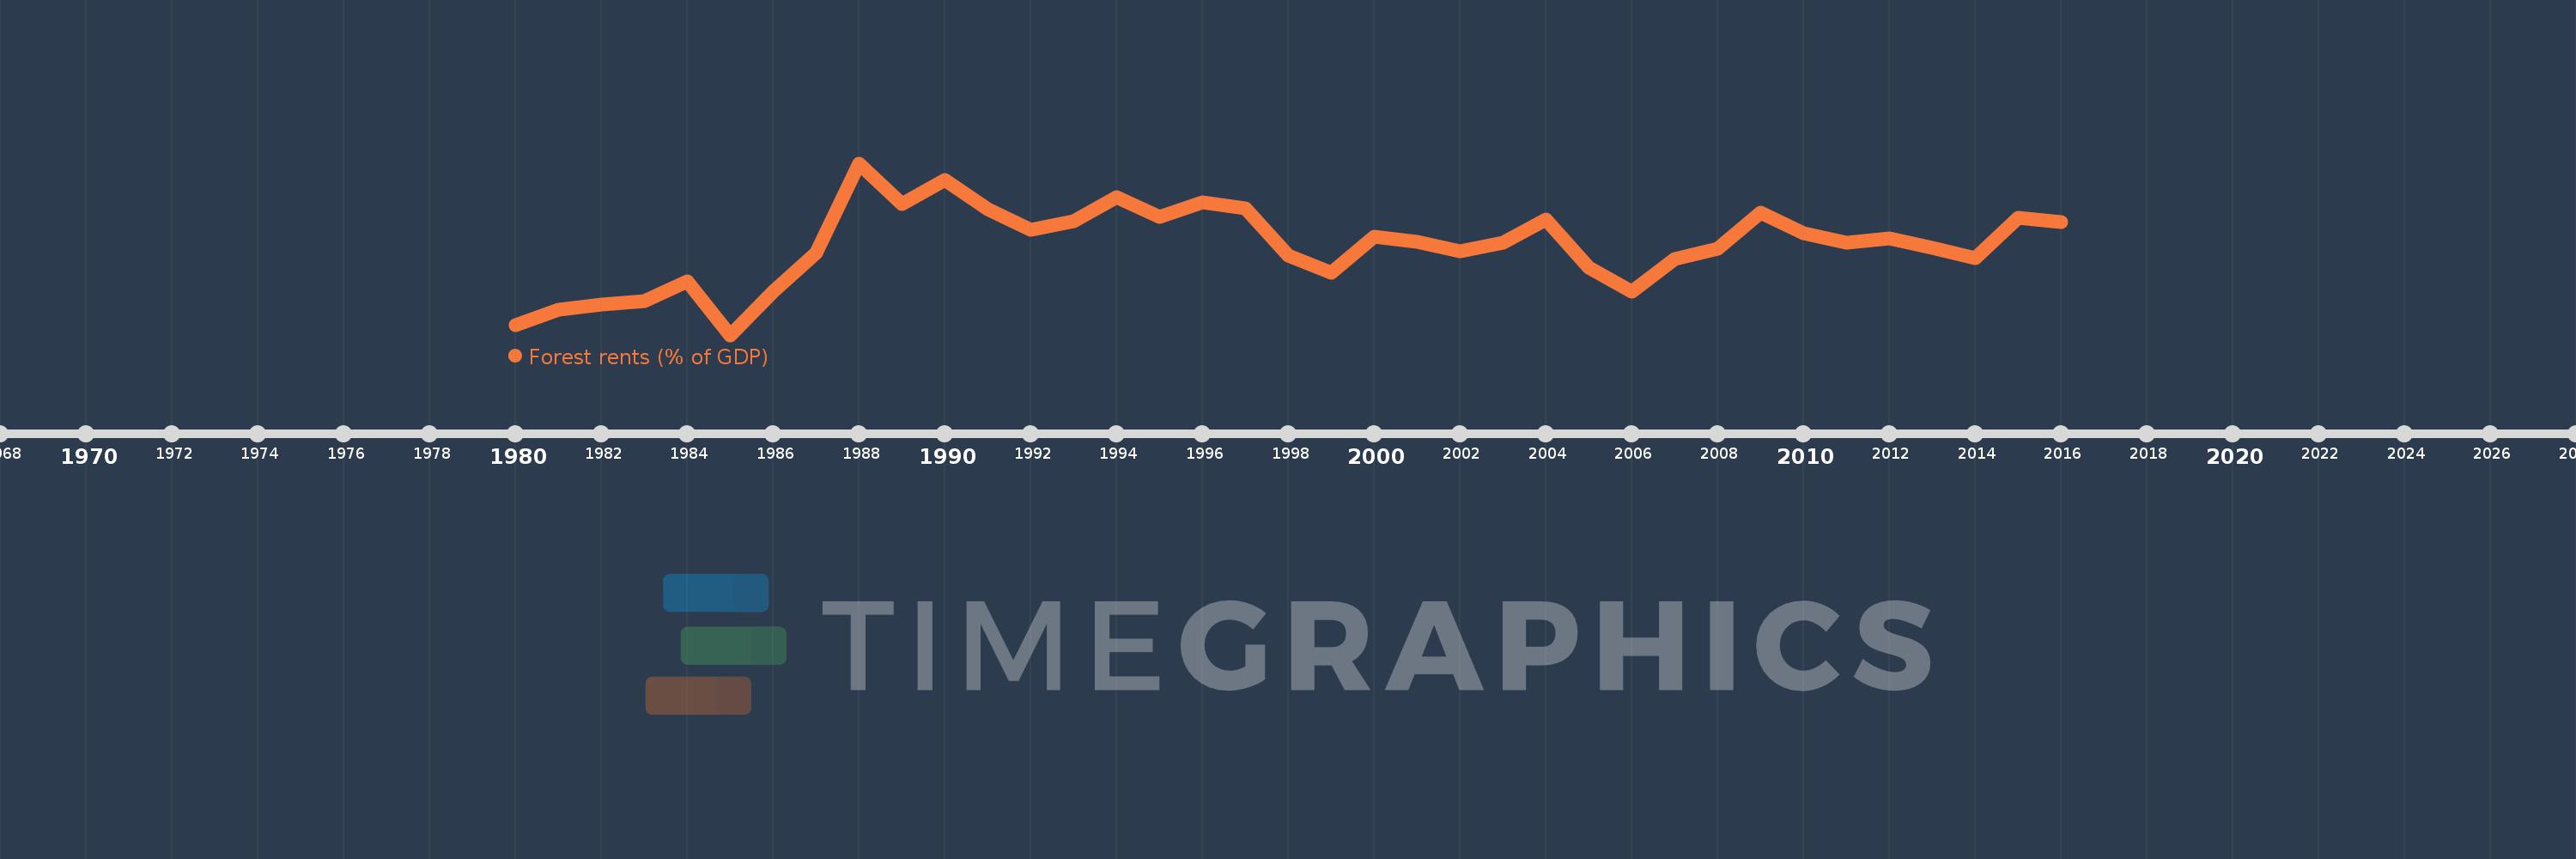
Forest rents (% of GDP)
2016,2015,2014,2013,2012,2011,2010,2009,2008,2007,2006,2005,2004,2003,2002,2001,2000,1999,1998,1997,1996,1995,1994,1993,1992,1991,1990,1989,1988,1987,1986,1985,1984,1983,1982,1981,1980
This statistics in other country:
AfghanistanAlbaniaAlgeriaAndorraAngolaArab WorldArgentinaArmeniaArubaAustraliaAustriaAzerbaijanBahamas, TheBahrainBangladeshBarbadosBelarusBelgiumBelizeBeninBhutanBoliviaBosnia and HerzegovinaBotswanaBrazilBrunei DarussalamBulgariaBurkina FasoBurundiCabo VerdeCambodiaCameroonCanadaCaribbean small statesCentral African RepublicCentral Europe and the BalticsChadChileChinaColombiaComorosCongo, Dem. Rep.Congo, Rep.Costa RicaCote d'IvoireCroatiaCubaCyprusCzech RepublicDenmarkDjiboutiDominicaDominican RepublicEarly-demographic dividendEast Asia & PacificEast Asia & Pacific (excluding high income)East Asia & Pacific (IDA & IBRD countries)EcuadorEgypt, Arab Rep.El SalvadorEquatorial GuineaEritreaEstoniaEthiopiaEuro areaEurope & Central AsiaEurope & Central Asia (excluding high income)Europe & Central Asia (IDA & IBRD countries)European UnionFaroe IslandsFijiFinlandFragile and conflict affected situationsFranceFrench PolynesiaGabonGambia, TheGeorgiaGermanyGhanaGreeceGuatemalaGuineaGuinea-BissauGuyanaHaitiHeavily indebted poor countries (HIPC)High incomeHondurasHong Kong SAR, ChinaHungaryIBRD onlyIcelandIDA & IBRD totalIDA blendIDA onlyIDA totalIndiaIndonesiaIran, Islamic Rep.IraqIrelandIsraelItalyJamaicaJapanJordanKazakhstanKenyaKiribatiKorea, Rep.KuwaitKyrgyz RepublicLao PDRLate-demographic dividendLatin America & Caribbean Latin America & Caribbean (excluding high income)Latin America & the Caribbean (IDA & IBRD countries)LatviaLeast developed countries: UN classificationLebanonLesothoLiberiaLibyaLiechtensteinLithuaniaLow & middle incomeLow incomeLower middle incomeLuxembourgMacao SAR, ChinaMacedonia, FYRMadagascarMalawiMalaysiaMaldivesMaliMaltaMauritaniaMauritiusMexicoMicronesia, Fed. Sts.Middle East & North AfricaMiddle East & North Africa (excluding high income)Middle East & North Africa (IDA & IBRD countries)Middle incomeMoldovaMongoliaMontenegroMoroccoMozambiqueMyanmarNamibiaNepalNetherlandsNew CaledoniaNew ZealandNicaraguaNigerNigeriaNorth AmericaNorwayOECD membersOmanOther small statesPacific island small statesPakistanPanamaPapua New GuineaParaguayPeruPhilippinesPolandPortugalPost-demographic dividendPre-demographic dividendQatarRomaniaRussian FederationRwandaSamoaSao Tome and PrincipeSaudi ArabiaSenegalSerbiaSeychellesSierra LeoneSingaporeSlovak RepublicSloveniaSmall statesSolomon IslandsSomaliaSouth AfricaSouth AsiaSouth Asia (IDA & IBRD)South SudanSpainSri LankaSt. LuciaSt. Vincent and the GrenadinesSub-Saharan Africa Sub-Saharan Africa (excluding high income)Sub-Saharan Africa (IDA & IBRD countries)SudanSurinameSwazilandSwedenSwitzerlandSyrian Arab RepublicTajikistanTanzaniaThailandTimor-LesteTogoTongaTrinidad and TobagoTunisiaTurkeyTurkmenistanUgandaUkraineUnited Arab EmiratesUnited KingdomUnited StatesUpper middle incomeUruguayUzbekistanVanuatuVenezuela, RBVietnamWorldYemen, Rep.ZambiaZimbabwe Timeline:
This timeline shows a graph from 1980 to 2016 of Vanuatu. No data until 1979. Number of actual observations by date: 37.
Source name:
World Development Indicators
Source organization:
Estimates based on sources and methods described in "The Changing Wealth of Nations: Measuring Sustainable Development in the New Millennium" (World Bank, 2011).
Categories, topics:
Environment
Last updated:
apr 23, 2017
Indicators value changes by year
At the date of observation
Value
Absolute change
Change from previous value
jan 1, 1980
0.389
+0.389
0.0%
jan 1, 1981
0.468
+0.079
20.28%
jan 1, 1982
0.493
+0.024
5.19%
jan 1, 1983
0.51
+0.018
3.57%
jan 1, 1984
0.608
+0.098
19.18%
jan 1, 1985
0.341
-0.268
-44.01%
jan 1, 1986
0.556
+0.216
63.31%
jan 1, 1987
0.748
+0.192
34.57%
jan 1, 1988
1.193
+0.445
59.45%
jan 1, 1989
0.991
-0.202
-16.92%
jan 1, 1990
1.112
+0.12
12.14%
jan 1, 1991
0.965
-0.146
-13.17%
jan 1, 1992
0.862
-0.103
-10.68%
jan 1, 1993
0.904
+0.041
4.8%
jan 1, 1994
1.024
+0.12
13.3%
jan 1, 1995
0.928
-0.096
-9.41%
jan 1, 1996
1.001
+0.073
7.9%
jan 1, 1997
0.968
-0.032
-3.23%
jan 1, 1998
0.736
-0.232
-23.96%
jan 1, 1999
0.648
-0.089
-12.05%
jan 1, 2000
0.83
+0.182
28.17%
jan 1, 2001
0.803
-0.027
-3.31%
jan 1, 2002
0.756
-0.047
-5.85%
jan 1, 2003
0.797
+0.041
5.46%
jan 1, 2004
0.912
+0.116
14.5%
jan 1, 2005
0.675
-0.238
-26.06%
jan 1, 2006
0.555
-0.12
-17.76%
jan 1, 2007
0.718
+0.163
29.37%
jan 1, 2008
0.769
+0.051
7.08%
jan 1, 2009
0.948
+0.179
23.34%
jan 1, 2010
0.847
-0.101
-10.63%
jan 1, 2011
0.797
-0.05
-5.96%
jan 1, 2012
0.819
+0.022
2.78%
jan 1, 2013
0.775
-0.044
-5.38%
jan 1, 2014
0.724
-0.051
-6.57%
jan 1, 2015
0.922
+0.199
27.46%
jan 1, 2016
0.901
-0.022
-2.33%
Ranking of countries by current statistics by years


Comments: