29
/
en
AIzaSyAYiBZKx7MnpbEhh9jyipgxe19OcubqV5w
April 1, 2024
264588
Togo
TGO
true
2
1
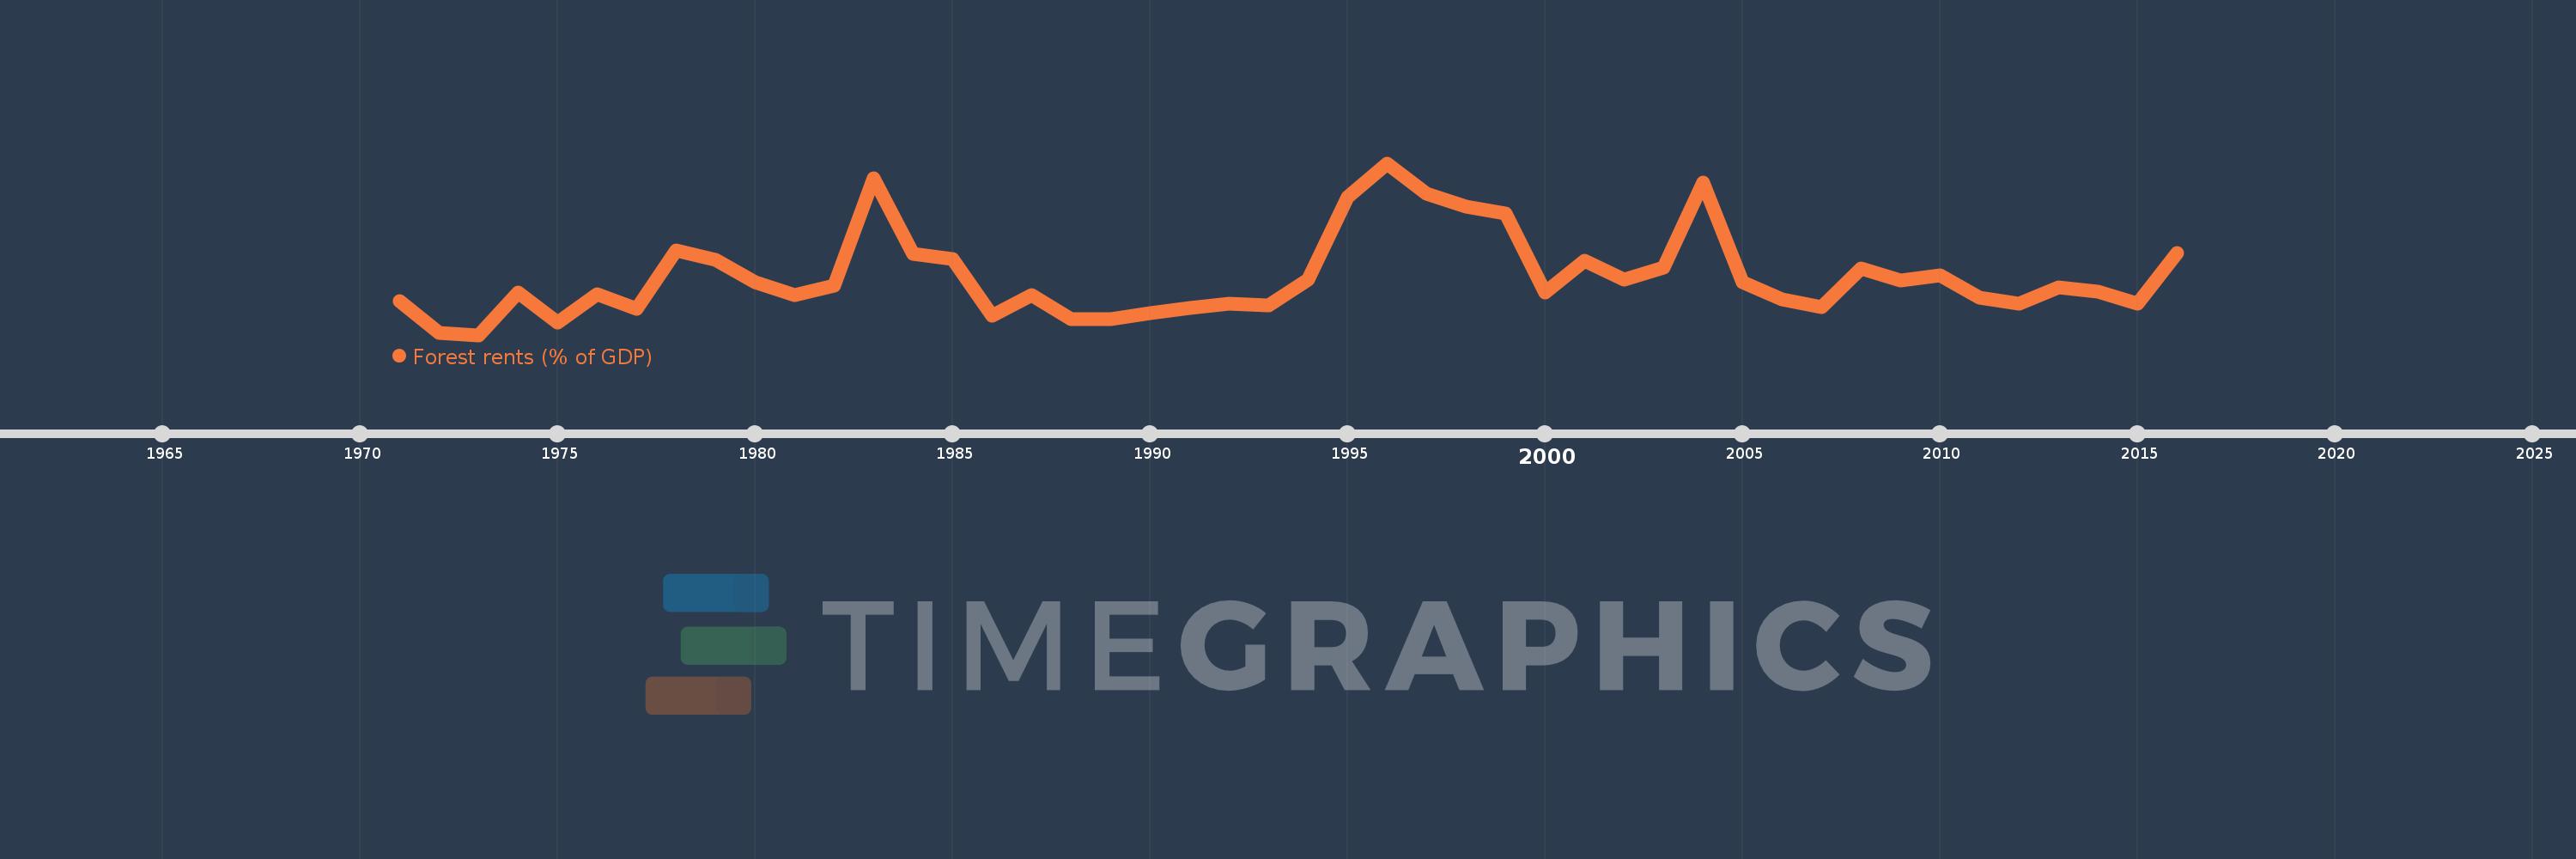
Forest rents (% of GDP)
2016,2015,2014,2013,2012,2011,2010,2009,2008,2007,2006,2005,2004,2003,2002,2001,2000,1999,1998,1997,1996,1995,1994,1993,1992,1991,1990,1989,1988,1987,1986,1985,1984,1983,1982,1981,1980,1979,1978,1977,1976,1975,1974,1973,1972,1971
This statistics in other country:
AfghanistanAlbaniaAlgeriaAndorraAngolaArab WorldArgentinaArmeniaArubaAustraliaAustriaAzerbaijanBahamas, TheBahrainBangladeshBarbadosBelarusBelgiumBelizeBeninBhutanBoliviaBosnia and HerzegovinaBotswanaBrazilBrunei DarussalamBulgariaBurkina FasoBurundiCabo VerdeCambodiaCameroonCanadaCaribbean small statesCentral African RepublicCentral Europe and the BalticsChadChileChinaColombiaComorosCongo, Dem. Rep.Congo, Rep.Costa RicaCote d'IvoireCroatiaCubaCyprusCzech RepublicDenmarkDjiboutiDominicaDominican RepublicEarly-demographic dividendEast Asia & PacificEast Asia & Pacific (excluding high income)East Asia & Pacific (IDA & IBRD countries)EcuadorEgypt, Arab Rep.El SalvadorEquatorial GuineaEritreaEstoniaEthiopiaEuro areaEurope & Central AsiaEurope & Central Asia (excluding high income)Europe & Central Asia (IDA & IBRD countries)European UnionFaroe IslandsFijiFinlandFragile and conflict affected situationsFranceFrench PolynesiaGabonGambia, TheGeorgiaGermanyGhanaGreeceGuatemalaGuineaGuinea-BissauGuyanaHaitiHeavily indebted poor countries (HIPC)High incomeHondurasHong Kong SAR, ChinaHungaryIBRD onlyIcelandIDA & IBRD totalIDA blendIDA onlyIDA totalIndiaIndonesiaIran, Islamic Rep.IraqIrelandIsraelItalyJamaicaJapanJordanKazakhstanKenyaKiribatiKorea, Rep.KuwaitKyrgyz RepublicLao PDRLate-demographic dividendLatin America & Caribbean Latin America & Caribbean (excluding high income)Latin America & the Caribbean (IDA & IBRD countries)LatviaLeast developed countries: UN classificationLebanonLesothoLiberiaLibyaLiechtensteinLithuaniaLow & middle incomeLow incomeLower middle incomeLuxembourgMacao SAR, ChinaMacedonia, FYRMadagascarMalawiMalaysiaMaldivesMaliMaltaMauritaniaMauritiusMexicoMicronesia, Fed. Sts.Middle East & North AfricaMiddle East & North Africa (excluding high income)Middle East & North Africa (IDA & IBRD countries)Middle incomeMoldovaMongoliaMontenegroMoroccoMozambiqueMyanmarNamibiaNepalNetherlandsNew CaledoniaNew ZealandNicaraguaNigerNigeriaNorth AmericaNorwayOECD membersOmanOther small statesPacific island small statesPakistanPanamaPapua New GuineaParaguayPeruPhilippinesPolandPortugalPost-demographic dividendPre-demographic dividendQatarRomaniaRussian FederationRwandaSamoaSao Tome and PrincipeSaudi ArabiaSenegalSerbiaSeychellesSierra LeoneSingaporeSlovak RepublicSloveniaSmall statesSolomon IslandsSomaliaSouth AfricaSouth AsiaSouth Asia (IDA & IBRD)South SudanSpainSri LankaSt. LuciaSt. Vincent and the GrenadinesSub-Saharan Africa Sub-Saharan Africa (excluding high income)Sub-Saharan Africa (IDA & IBRD countries)SudanSurinameSwazilandSwedenSwitzerlandSyrian Arab RepublicTajikistanTanzaniaThailandTimor-LesteTogoTongaTrinidad and TobagoTunisiaTurkeyTurkmenistanUgandaUkraineUnited Arab EmiratesUnited KingdomUnited StatesUpper middle incomeUruguayUzbekistanVanuatuVenezuela, RBVietnamWorldYemen, Rep.ZambiaZimbabwe Timeline:
This timeline shows a graph from 1971 to 2016 of Togo. No data until 1970. Number of actual observations by date: 46.
Source name:
World Development Indicators
Source organization:
Estimates based on sources and methods described in "The Changing Wealth of Nations: Measuring Sustainable Development in the New Millennium" (World Bank, 2011).
Categories, topics:
Environment
Last updated:
apr 23, 2017
Indicators value changes by year
Maximum:
12.627
jan 1, 1996
At the date of observation
Value
Absolute change
Change from previous value
jan 1, 1971
6.388
+6.388
0.0%
jan 1, 1972
4.976
-1.412
-22.11%
jan 1, 1973
4.876
-0.099
-1.99%
jan 1, 1974
6.78
+1.904
39.04%
jan 1, 1975
5.446
-1.334
-19.67%
jan 1, 1976
6.732
+1.286
23.61%
jan 1, 1977
6.064
-0.668
-9.92%
jan 1, 1978
8.679
+2.615
43.12%
jan 1, 1979
8.252
-0.427
-4.93%
jan 1, 1980
7.241
-1.011
-12.25%
jan 1, 1981
6.683
-0.557
-7.7%
jan 1, 1982
7.099
+0.416
6.22%
jan 1, 1983
11.961
+4.862
68.49%
jan 1, 1984
8.529
-3.432
-28.69%
jan 1, 1985
8.303
-0.226
-2.65%
jan 1, 1986
5.748
-2.555
-30.77%
jan 1, 1987
6.677
+0.928
16.15%
jan 1, 1988
5.597
-1.08
-16.17%
jan 1, 1989
5.595
-0.002
-0.03%
jan 1, 1990
5.857
+0.262
4.67%
jan 1, 1991
6.112
+0.255
4.35%
jan 1, 1992
6.297
+0.185
3.03%
jan 1, 1993
6.232
-0.064
-1.02%
jan 1, 1994
7.361
+1.129
18.12%
jan 1, 1995
11.106
+3.745
50.87%
jan 1, 1996
12.627
+1.521
13.69%
jan 1, 1997
11.252
-1.375
-10.89%
jan 1, 1998
10.675
-0.576
-5.12%
jan 1, 1999
10.378
-0.298
-2.79%
jan 1, 2000
6.803
-3.575
-34.45%
jan 1, 2001
8.232
+1.43
21.02%
jan 1, 2002
7.38
-0.852
-10.35%
jan 1, 2003
7.91
+0.53
7.18%
jan 1, 2004
11.762
+3.852
48.7%
jan 1, 2005
7.245
-4.517
-38.4%
jan 1, 2006
6.465
-0.78
-10.77%
jan 1, 2007
6.13
-0.335
-5.18%
jan 1, 2008
7.872
+1.742
28.41%
jan 1, 2009
7.354
-0.518
-6.58%
jan 1, 2010
7.554
+0.2
2.72%
jan 1, 2011
6.56
-0.994
-13.16%
jan 1, 2012
6.288
-0.271
-4.14%
jan 1, 2013
7.014
+0.725
11.53%
jan 1, 2014
6.819
-0.194
-2.77%
jan 1, 2015
6.282
-0.537
-7.87%
jan 1, 2016
8.593
+2.311
36.79%
Ranking of countries by current statistics by years


Comments: