29
/
en
AIzaSyAYiBZKx7MnpbEhh9jyipgxe19OcubqV5w
April 1, 2024
51842
North America
NAC
false
2
1
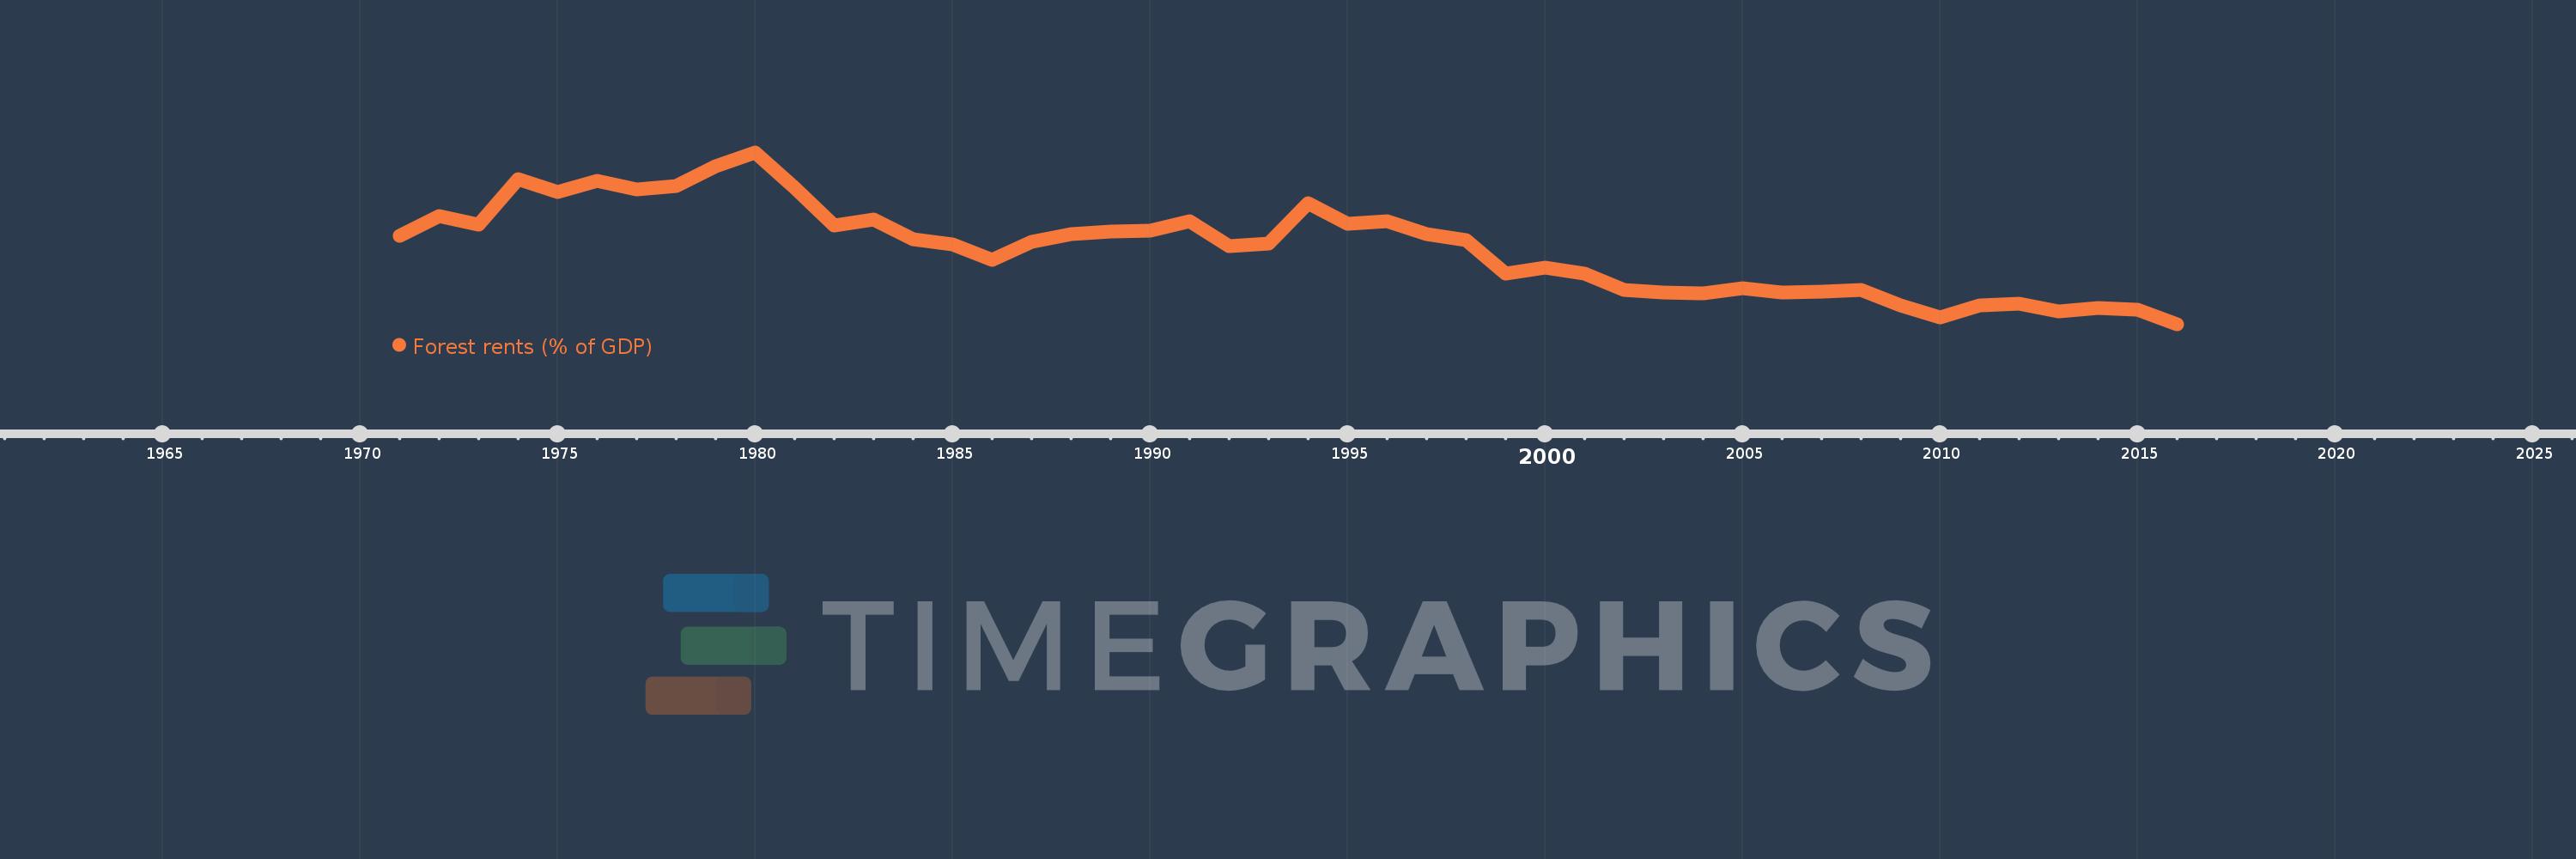
Forest rents (% of GDP)
2016,2015,2014,2013,2012,2011,2010,2009,2008,2007,2006,2005,2004,2003,2002,2001,2000,1999,1998,1997,1996,1995,1994,1993,1992,1991,1990,1989,1988,1987,1986,1985,1984,1983,1982,1981,1980,1979,1978,1977,1976,1975,1974,1973,1972,1971
This statistics in other country:
AfghanistanAlbaniaAlgeriaAndorraAngolaArab WorldArgentinaArmeniaArubaAustraliaAustriaAzerbaijanBahamas, TheBahrainBangladeshBarbadosBelarusBelgiumBelizeBeninBhutanBoliviaBosnia and HerzegovinaBotswanaBrazilBrunei DarussalamBulgariaBurkina FasoBurundiCabo VerdeCambodiaCameroonCanadaCaribbean small statesCentral African RepublicCentral Europe and the BalticsChadChileChinaColombiaComorosCongo, Dem. Rep.Congo, Rep.Costa RicaCote d'IvoireCroatiaCubaCyprusCzech RepublicDenmarkDjiboutiDominicaDominican RepublicEarly-demographic dividendEast Asia & PacificEast Asia & Pacific (excluding high income)East Asia & Pacific (IDA & IBRD countries)EcuadorEgypt, Arab Rep.El SalvadorEquatorial GuineaEritreaEstoniaEthiopiaEuro areaEurope & Central AsiaEurope & Central Asia (excluding high income)Europe & Central Asia (IDA & IBRD countries)European UnionFaroe IslandsFijiFinlandFragile and conflict affected situationsFranceFrench PolynesiaGabonGambia, TheGeorgiaGermanyGhanaGreeceGuatemalaGuineaGuinea-BissauGuyanaHaitiHeavily indebted poor countries (HIPC)High incomeHondurasHong Kong SAR, ChinaHungaryIBRD onlyIcelandIDA & IBRD totalIDA blendIDA onlyIDA totalIndiaIndonesiaIran, Islamic Rep.IraqIrelandIsraelItalyJamaicaJapanJordanKazakhstanKenyaKiribatiKorea, Rep.KuwaitKyrgyz RepublicLao PDRLate-demographic dividendLatin America & Caribbean Latin America & Caribbean (excluding high income)Latin America & the Caribbean (IDA & IBRD countries)LatviaLeast developed countries: UN classificationLebanonLesothoLiberiaLibyaLiechtensteinLithuaniaLow & middle incomeLow incomeLower middle incomeLuxembourgMacao SAR, ChinaMacedonia, FYRMadagascarMalawiMalaysiaMaldivesMaliMaltaMauritaniaMauritiusMexicoMicronesia, Fed. Sts.Middle East & North AfricaMiddle East & North Africa (excluding high income)Middle East & North Africa (IDA & IBRD countries)Middle incomeMoldovaMongoliaMontenegroMoroccoMozambiqueMyanmarNamibiaNepalNetherlandsNew CaledoniaNew ZealandNicaraguaNigerNigeriaNorth AmericaNorwayOECD membersOmanOther small statesPacific island small statesPakistanPanamaPapua New GuineaParaguayPeruPhilippinesPolandPortugalPost-demographic dividendPre-demographic dividendQatarRomaniaRussian FederationRwandaSamoaSao Tome and PrincipeSaudi ArabiaSenegalSerbiaSeychellesSierra LeoneSingaporeSlovak RepublicSloveniaSmall statesSolomon IslandsSomaliaSouth AfricaSouth AsiaSouth Asia (IDA & IBRD)South SudanSpainSri LankaSt. LuciaSt. Vincent and the GrenadinesSub-Saharan Africa Sub-Saharan Africa (excluding high income)Sub-Saharan Africa (IDA & IBRD countries)SudanSurinameSwazilandSwedenSwitzerlandSyrian Arab RepublicTajikistanTanzaniaThailandTimor-LesteTogoTongaTrinidad and TobagoTunisiaTurkeyTurkmenistanUgandaUkraineUnited Arab EmiratesUnited KingdomUnited StatesUpper middle incomeUruguayUzbekistanVanuatuVenezuela, RBVietnamWorldYemen, Rep.ZambiaZimbabwe Timeline:
This timeline shows a graph from 1971 to 2016 of North America. No data until 1970. Number of actual observations by date: 46.
Source name:
World Development Indicators
Source organization:
Estimates based on sources and methods described in "The Changing Wealth of Nations: Measuring Sustainable Development in the New Millennium" (World Bank, 2011).
Categories, topics:
Environment
Last updated:
apr 23, 2017
Indicators value changes by year
At the date of observation
Value
Absolute change
Change from previous value
jan 1, 1971
0.116
+0.116
0.0%
jan 1, 1972
0.135
+0.019
16.1%
jan 1, 1973
0.127
-0.008
-6.04%
jan 1, 1974
0.17
+0.043
34.16%
jan 1, 1975
0.158
-0.013
-7.41%
jan 1, 1976
0.168
+0.01
6.41%
jan 1, 1977
0.16
-0.008
-4.86%
jan 1, 1978
0.163
+0.004
2.24%
jan 1, 1979
0.182
+0.019
11.62%
jan 1, 1980
0.195
+0.013
7.35%
jan 1, 1981
0.162
-0.033
-16.94%
jan 1, 1982
0.126
-0.037
-22.7%
jan 1, 1983
0.132
+0.006
4.89%
jan 1, 1984
0.113
-0.018
-13.82%
jan 1, 1985
0.108
-0.005
-4.63%
jan 1, 1986
0.094
-0.014
-13.06%
jan 1, 1987
0.111
+0.017
18.46%
jan 1, 1988
0.118
+0.006
5.6%
jan 1, 1989
0.12
+0.002
1.74%
jan 1, 1990
0.121
+0.001
1.14%
jan 1, 1991
0.13
+0.009
7.64%
jan 1, 1992
0.107
-0.024
-18.06%
jan 1, 1993
0.109
+0.002
1.81%
jan 1, 1994
0.147
+0.039
35.62%
jan 1, 1995
0.128
-0.02
-13.32%
jan 1, 1996
0.13
+0.002
1.4%
jan 1, 1997
0.118
-0.011
-8.71%
jan 1, 1998
0.112
-0.006
-5.26%
jan 1, 1999
0.081
-0.031
-27.59%
jan 1, 2000
0.086
+0.005
5.61%
jan 1, 2001
0.081
-0.005
-5.6%
jan 1, 2002
0.065
-0.016
-19.33%
jan 1, 2003
0.063
-0.002
-2.83%
jan 1, 2004
0.062
-0.002
-2.39%
jan 1, 2005
0.067
+0.005
8.8%
jan 1, 2006
0.063
-0.004
-5.77%
jan 1, 2007
0.064
+0.0
0.2%
jan 1, 2008
0.065
+0.002
2.45%
jan 1, 2009
0.051
-0.014
-21.45%
jan 1, 2010
0.039
-0.013
-24.54%
jan 1, 2011
0.051
+0.013
32.97%
jan 1, 2012
0.052
+0.0
0.88%
jan 1, 2013
0.045
-0.007
-13.13%
jan 1, 2014
0.048
+0.003
7.19%
jan 1, 2015
0.047
-0.001
-1.86%
jan 1, 2016
0.033
-0.014
-30.35%
Ranking of countries by current statistics by years


Comments: