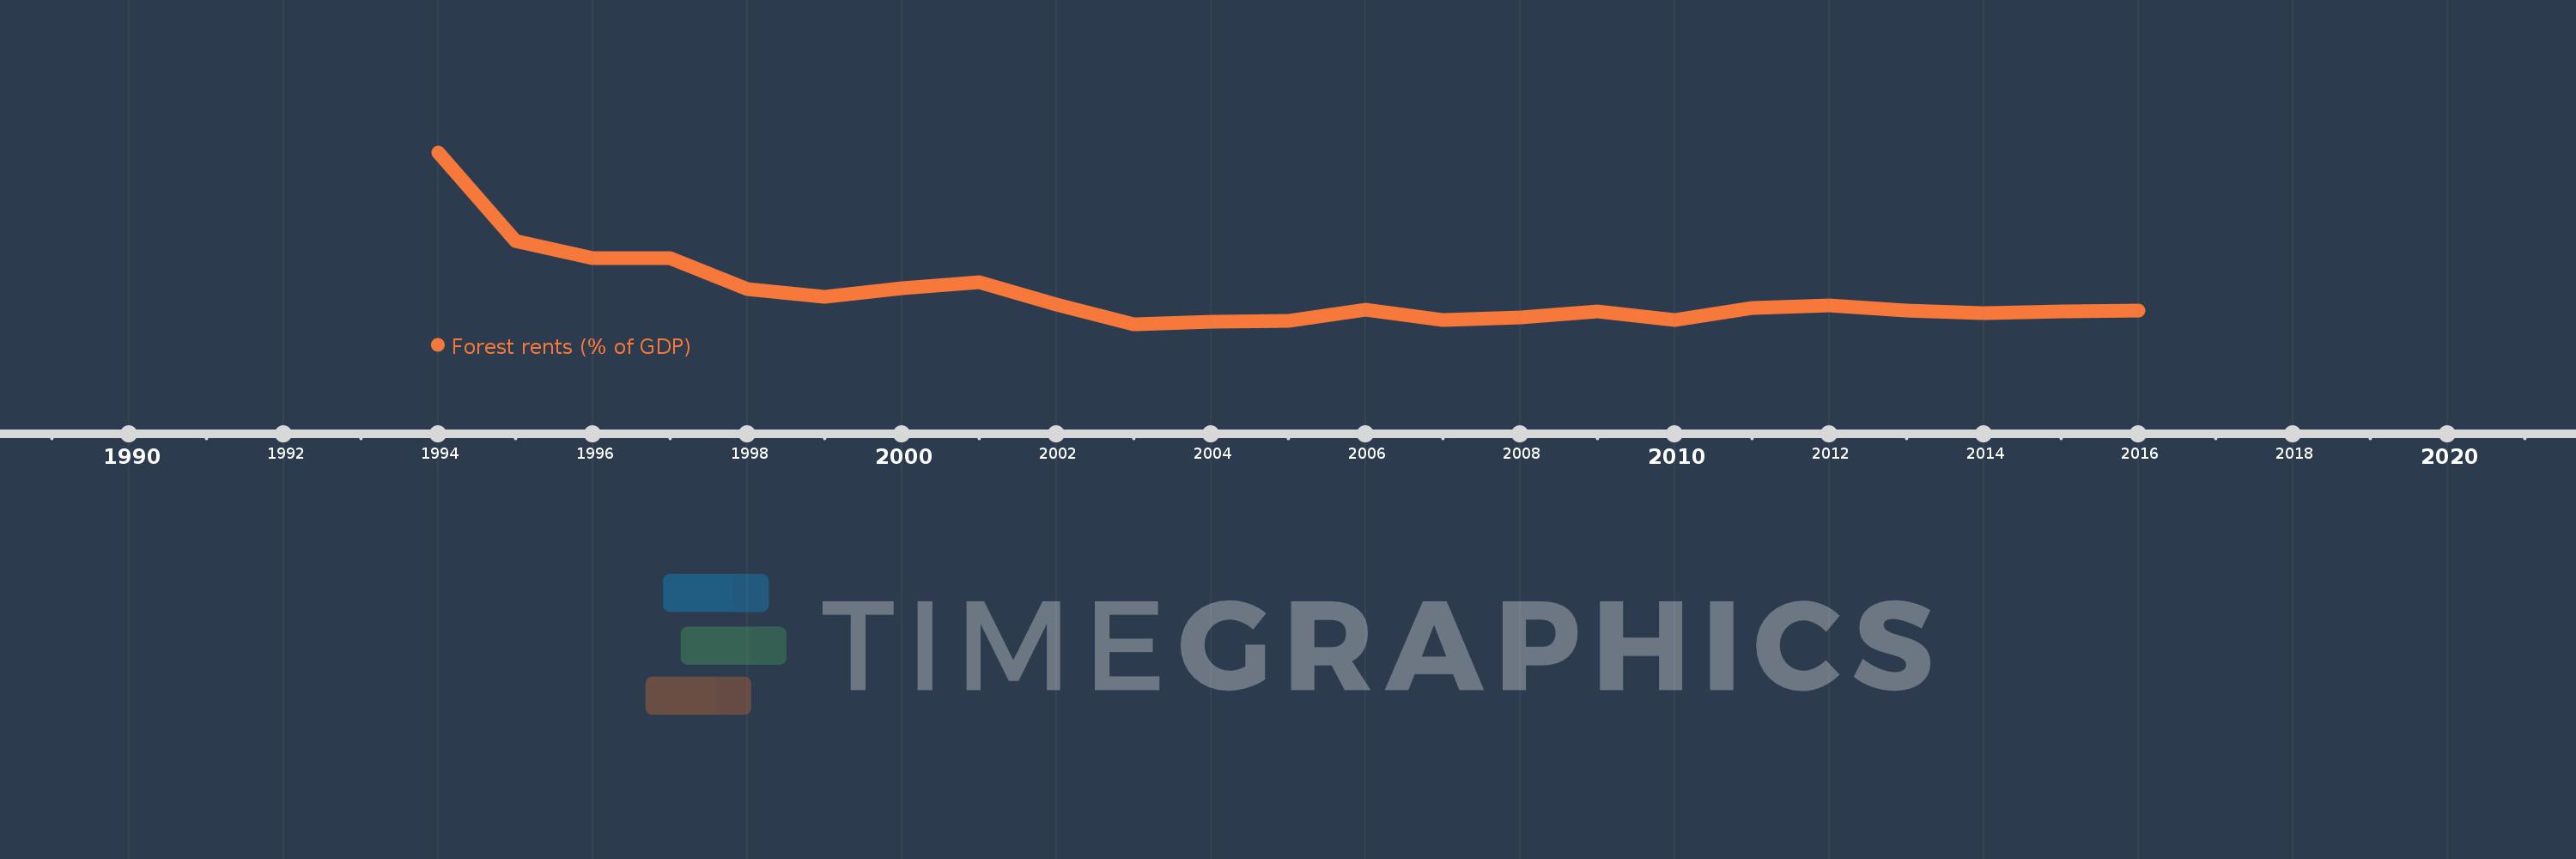
This timeline shows a graph from 1994 to 2016 of Slovak Republic. No data until 1993. Number of actual observations by date: 23.
Source name:
World Development Indicators
Source organization:
Estimates based on sources and methods described in "The Changing Wealth of Nations: Measuring Sustainable Development in the New Millennium" (World Bank, 2011).
Categories, topics:
Environment
Last updated:
apr 23, 2017
Indicators value changes by year
Meaning:
0.307
Minimum:
0.213
jan 1, 2003
Maximum:
0.757
jan 1, 1994
At the date of observation
Value
Absolute change
Change from the previous value
jan 1, 1994
0.757
+0.757
0.0%
jan 1, 1995
0.476
-0.281
-37.08%
jan 1, 1996
0.421
-0.056
-11.67%
jan 1, 1997
0.423
+0.003
0.66%
jan 1, 1998
0.325
-0.098
-23.15%
jan 1, 1999
0.3
-0.025
-7.71%
jan 1, 2000
0.328
+0.028
9.36%
jan 1, 2001
0.345
+0.017
5.03%
jan 1, 2002
0.274
-0.071
-20.55%
jan 1, 2003
0.213
-0.061
-22.43%
jan 1, 2004
0.22
+0.008
3.74%
jan 1, 2005
0.224
+0.004
1.59%
jan 1, 2006
0.259
+0.035
15.74%
jan 1, 2007
0.225
-0.034
-13.15%
jan 1, 2008
0.234
+0.009
3.98%
jan 1, 2009
0.253
+0.019
7.92%
jan 1, 2010
0.227
-0.025
-10.07%
jan 1, 2011
0.265
+0.038
16.67%
jan 1, 2012
0.272
+0.007
2.7%
jan 1, 2013
0.256
-0.016
-6.02%
jan 1, 2014
0.248
-0.008
-3.0%
jan 1, 2015
0.254
+0.006
2.37%
jan 1, 2016
0.256
+0.002
0.83%
Ranking of countries by current statistics by years
