29
/
en
AIzaSyAYiBZKx7MnpbEhh9jyipgxe19OcubqV5w
April 1, 2024
146829
Guinea-Bissau
GNB
true
2
1
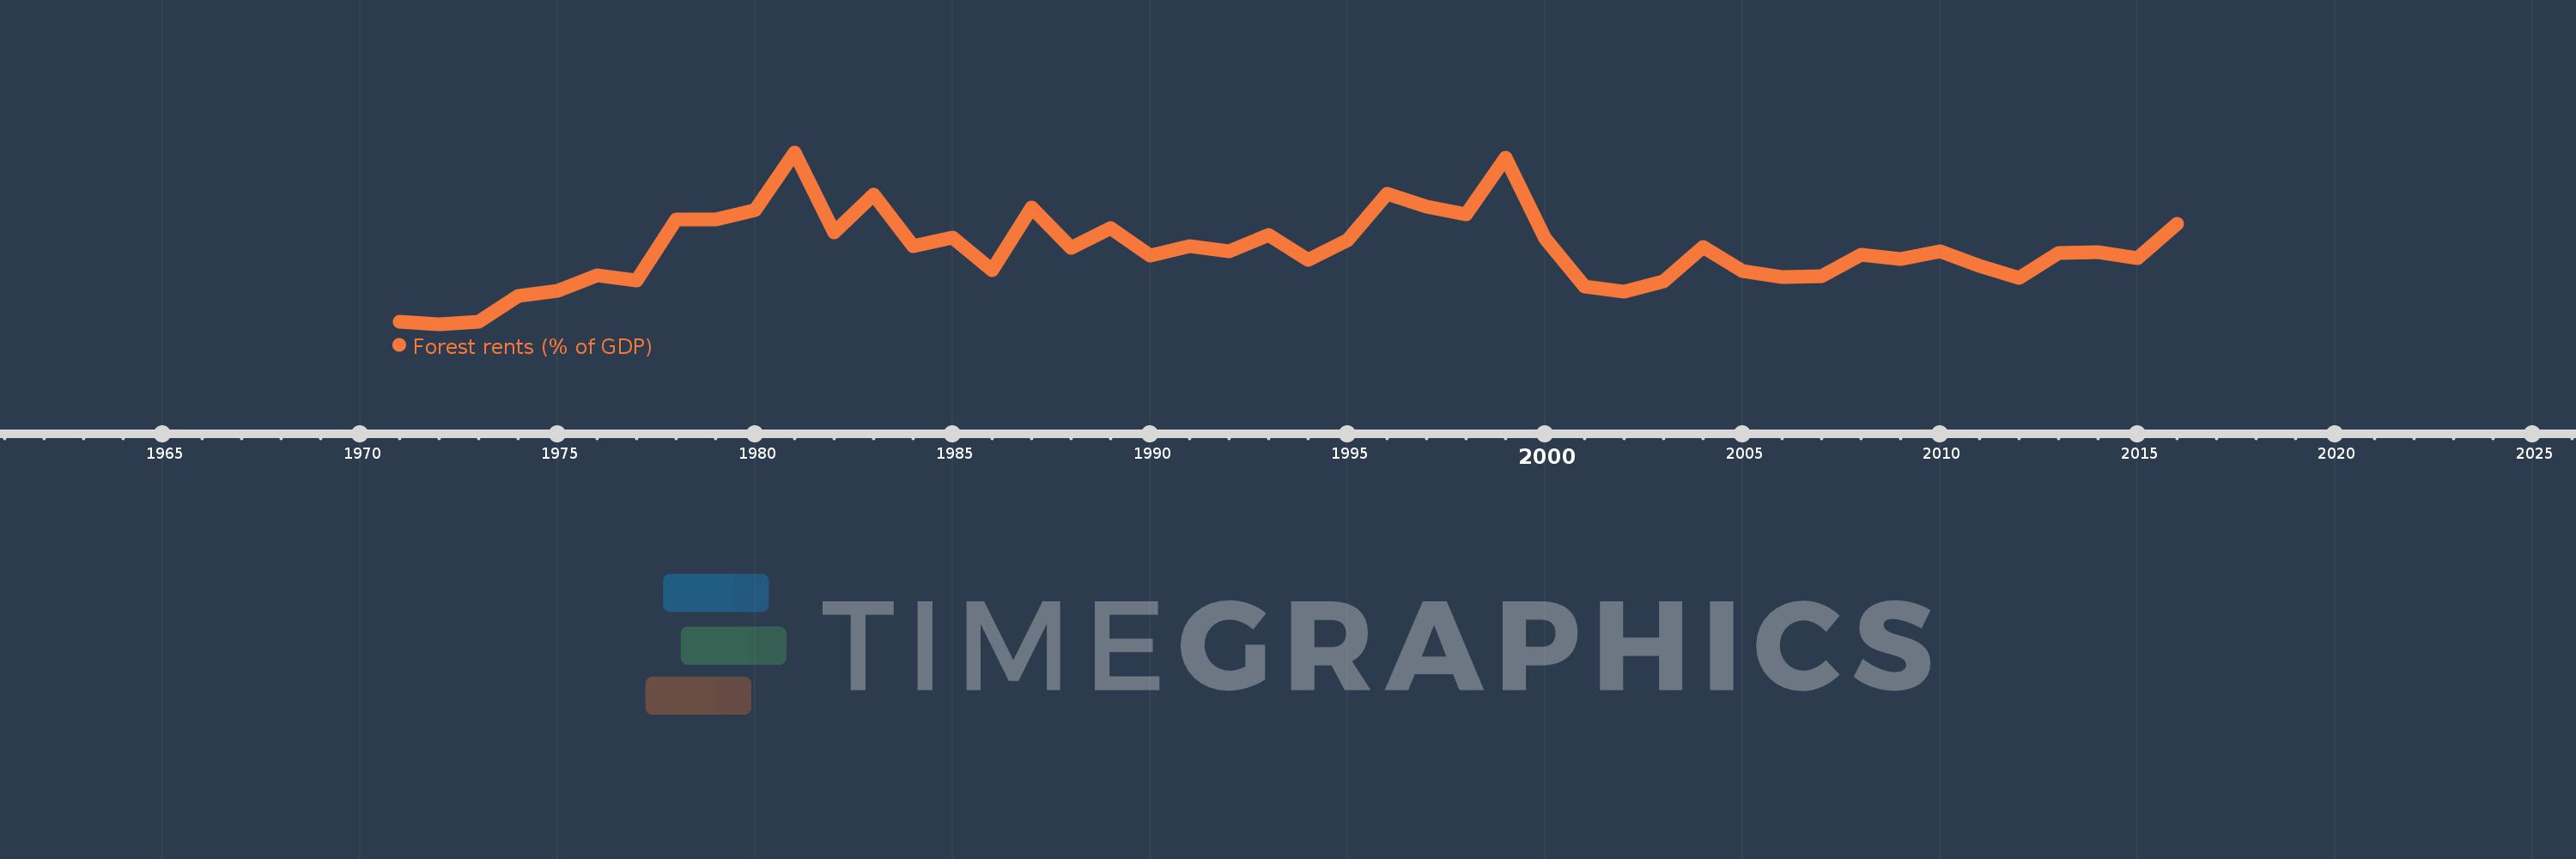
Forest rents (% of GDP)
2016,2015,2014,2013,2012,2011,2010,2009,2008,2007,2006,2005,2004,2003,2002,2001,2000,1999,1998,1997,1996,1995,1994,1993,1992,1991,1990,1989,1988,1987,1986,1985,1984,1983,1982,1981,1980,1979,1978,1977,1976,1975,1974,1973,1972,1971
This statistics in other country:
AfghanistanAlbaniaAlgeriaAndorraAngolaArab WorldArgentinaArmeniaArubaAustraliaAustriaAzerbaijanBahamas, TheBahrainBangladeshBarbadosBelarusBelgiumBelizeBeninBhutanBoliviaBosnia and HerzegovinaBotswanaBrazilBrunei DarussalamBulgariaBurkina FasoBurundiCabo VerdeCambodiaCameroonCanadaCaribbean small statesCentral African RepublicCentral Europe and the BalticsChadChileChinaColombiaComorosCongo, Dem. Rep.Congo, Rep.Costa RicaCote d'IvoireCroatiaCubaCyprusCzech RepublicDenmarkDjiboutiDominicaDominican RepublicEarly-demographic dividendEast Asia & PacificEast Asia & Pacific (excluding high income)East Asia & Pacific (IDA & IBRD countries)EcuadorEgypt, Arab Rep.El SalvadorEquatorial GuineaEritreaEstoniaEthiopiaEuro areaEurope & Central AsiaEurope & Central Asia (excluding high income)Europe & Central Asia (IDA & IBRD countries)European UnionFaroe IslandsFijiFinlandFragile and conflict affected situationsFranceFrench PolynesiaGabonGambia, TheGeorgiaGermanyGhanaGreeceGuatemalaGuineaGuinea-BissauGuyanaHaitiHeavily indebted poor countries (HIPC)High incomeHondurasHong Kong SAR, ChinaHungaryIBRD onlyIcelandIDA & IBRD totalIDA blendIDA onlyIDA totalIndiaIndonesiaIran, Islamic Rep.IraqIrelandIsraelItalyJamaicaJapanJordanKazakhstanKenyaKiribatiKorea, Rep.KuwaitKyrgyz RepublicLao PDRLate-demographic dividendLatin America & Caribbean Latin America & Caribbean (excluding high income)Latin America & the Caribbean (IDA & IBRD countries)LatviaLeast developed countries: UN classificationLebanonLesothoLiberiaLibyaLiechtensteinLithuaniaLow & middle incomeLow incomeLower middle incomeLuxembourgMacao SAR, ChinaMacedonia, FYRMadagascarMalawiMalaysiaMaldivesMaliMaltaMauritaniaMauritiusMexicoMicronesia, Fed. Sts.Middle East & North AfricaMiddle East & North Africa (excluding high income)Middle East & North Africa (IDA & IBRD countries)Middle incomeMoldovaMongoliaMontenegroMoroccoMozambiqueMyanmarNamibiaNepalNetherlandsNew CaledoniaNew ZealandNicaraguaNigerNigeriaNorth AmericaNorwayOECD membersOmanOther small statesPacific island small statesPakistanPanamaPapua New GuineaParaguayPeruPhilippinesPolandPortugalPost-demographic dividendPre-demographic dividendQatarRomaniaRussian FederationRwandaSamoaSao Tome and PrincipeSaudi ArabiaSenegalSerbiaSeychellesSierra LeoneSingaporeSlovak RepublicSloveniaSmall statesSolomon IslandsSomaliaSouth AfricaSouth AsiaSouth Asia (IDA & IBRD)South SudanSpainSri LankaSt. LuciaSt. Vincent and the GrenadinesSub-Saharan Africa Sub-Saharan Africa (excluding high income)Sub-Saharan Africa (IDA & IBRD countries)SudanSurinameSwazilandSwedenSwitzerlandSyrian Arab RepublicTajikistanTanzaniaThailandTimor-LesteTogoTongaTrinidad and TobagoTunisiaTurkeyTurkmenistanUgandaUkraineUnited Arab EmiratesUnited KingdomUnited StatesUpper middle incomeUruguayUzbekistanVanuatuVenezuela, RBVietnamWorldYemen, Rep.ZambiaZimbabwe Timeline:
This timeline shows a graph from 1971 to 2016 of Guinea-Bissau. No data until 1970. Number of actual observations by date: 46.
Source name:
World Development Indicators
Source organization:
Estimates based on sources and methods described in "The Changing Wealth of Nations: Measuring Sustainable Development in the New Millennium" (World Bank, 2011).
Categories, topics:
Environment
Last updated:
apr 23, 2017
Indicators value changes by year
Maximum:
32.435
jan 1, 1981
At the date of observation
Value
Absolute change
Change from previous value
jan 1, 1971
6.392
+6.392
0.0%
jan 1, 1972
6.043
-0.348
-5.45%
jan 1, 1973
6.468
+0.425
7.02%
jan 1, 1974
10.382
+3.915
60.52%
jan 1, 1975
11.121
+0.738
7.11%
jan 1, 1976
13.553
+2.433
21.88%
jan 1, 1977
12.743
-0.81
-5.98%
jan 1, 1978
22.07
+9.327
73.19%
jan 1, 1979
22.18
+0.111
0.5%
jan 1, 1980
23.601
+1.421
6.4%
jan 1, 1981
32.435
+8.834
37.43%
jan 1, 1982
20.136
-12.299
-37.92%
jan 1, 1983
25.91
+5.774
28.67%
jan 1, 1984
18.101
-7.809
-30.14%
jan 1, 1985
19.413
+1.312
7.25%
jan 1, 1986
14.399
-5.014
-25.83%
jan 1, 1987
24.034
+9.635
66.92%
jan 1, 1988
17.722
-6.311
-26.26%
jan 1, 1989
20.866
+3.144
17.74%
jan 1, 1990
16.567
-4.299
-20.6%
jan 1, 1991
18.088
+1.521
9.18%
jan 1, 1992
17.301
-0.787
-4.35%
jan 1, 1993
19.785
+2.484
14.36%
jan 1, 1994
15.972
-3.813
-19.27%
jan 1, 1995
19.009
+3.037
19.01%
jan 1, 1996
26.062
+7.052
37.1%
jan 1, 1997
24.171
-1.891
-7.26%
jan 1, 1998
22.874
-1.297
-5.37%
jan 1, 1999
31.591
+8.717
38.11%
jan 1, 2000
19.264
-12.327
-39.02%
jan 1, 2001
11.882
-7.382
-38.32%
jan 1, 2002
11.001
-0.881
-7.41%
jan 1, 2003
12.6
+1.598
14.53%
jan 1, 2004
17.874
+5.274
41.86%
jan 1, 2005
14.163
-3.711
-20.76%
jan 1, 2006
13.248
-0.915
-6.46%
jan 1, 2007
13.372
+0.124
0.94%
jan 1, 2008
16.733
+3.361
25.13%
jan 1, 2009
16.057
-0.676
-4.04%
jan 1, 2010
17.292
+1.235
7.69%
jan 1, 2011
14.995
-2.297
-13.28%
jan 1, 2012
13.182
-1.813
-12.09%
jan 1, 2013
16.979
+3.797
28.81%
jan 1, 2014
17.086
+0.106
0.63%
jan 1, 2015
16.195
-0.891
-5.21%
jan 1, 2016
21.447
+5.252
32.43%
Ranking of countries by current statistics by years


Comments: