29
/
en
AIzaSyAYiBZKx7MnpbEhh9jyipgxe19OcubqV5w
April 1, 2024
46096
Low income
LIC
false
2
1
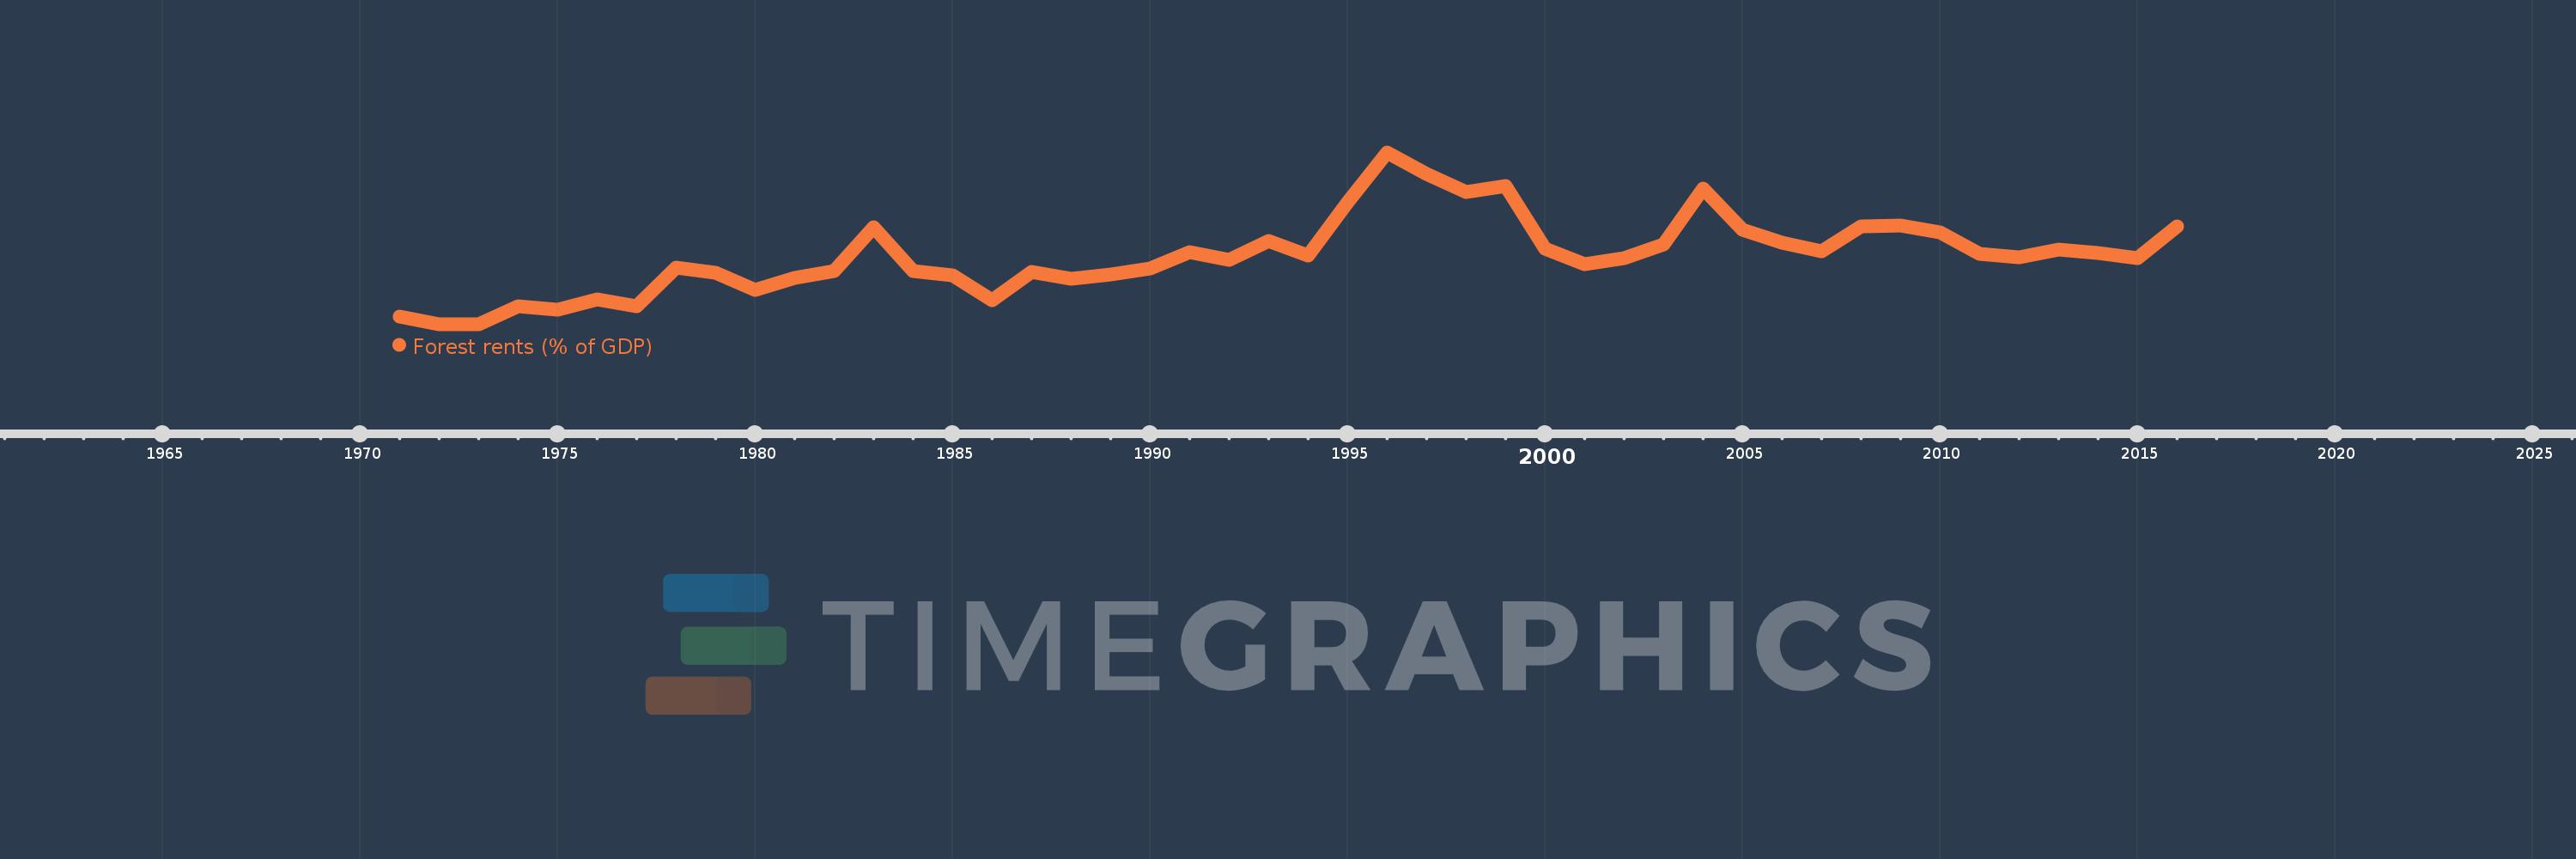
Forest rents (% of GDP)
2016,2015,2014,2013,2012,2011,2010,2009,2008,2007,2006,2005,2004,2003,2002,2001,2000,1999,1998,1997,1996,1995,1994,1993,1992,1991,1990,1989,1988,1987,1986,1985,1984,1983,1982,1981,1980,1979,1978,1977,1976,1975,1974,1973,1972,1971
This statistics in other country:
AfghanistanAlbaniaAlgeriaAndorraAngolaArab WorldArgentinaArmeniaArubaAustraliaAustriaAzerbaijanBahamas, TheBahrainBangladeshBarbadosBelarusBelgiumBelizeBeninBhutanBoliviaBosnia and HerzegovinaBotswanaBrazilBrunei DarussalamBulgariaBurkina FasoBurundiCabo VerdeCambodiaCameroonCanadaCaribbean small statesCentral African RepublicCentral Europe and the BalticsChadChileChinaColombiaComorosCongo, Dem. Rep.Congo, Rep.Costa RicaCote d'IvoireCroatiaCubaCyprusCzech RepublicDenmarkDjiboutiDominicaDominican RepublicEarly-demographic dividendEast Asia & PacificEast Asia & Pacific (excluding high income)East Asia & Pacific (IDA & IBRD countries)EcuadorEgypt, Arab Rep.El SalvadorEquatorial GuineaEritreaEstoniaEthiopiaEuro areaEurope & Central AsiaEurope & Central Asia (excluding high income)Europe & Central Asia (IDA & IBRD countries)European UnionFaroe IslandsFijiFinlandFragile and conflict affected situationsFranceFrench PolynesiaGabonGambia, TheGeorgiaGermanyGhanaGreeceGuatemalaGuineaGuinea-BissauGuyanaHaitiHeavily indebted poor countries (HIPC)High incomeHondurasHong Kong SAR, ChinaHungaryIBRD onlyIcelandIDA & IBRD totalIDA blendIDA onlyIDA totalIndiaIndonesiaIran, Islamic Rep.IraqIrelandIsraelItalyJamaicaJapanJordanKazakhstanKenyaKiribatiKorea, Rep.KuwaitKyrgyz RepublicLao PDRLate-demographic dividendLatin America & Caribbean Latin America & Caribbean (excluding high income)Latin America & the Caribbean (IDA & IBRD countries)LatviaLeast developed countries: UN classificationLebanonLesothoLiberiaLibyaLiechtensteinLithuaniaLow & middle incomeLow incomeLower middle incomeLuxembourgMacao SAR, ChinaMacedonia, FYRMadagascarMalawiMalaysiaMaldivesMaliMaltaMauritaniaMauritiusMexicoMicronesia, Fed. Sts.Middle East & North AfricaMiddle East & North Africa (excluding high income)Middle East & North Africa (IDA & IBRD countries)Middle incomeMoldovaMongoliaMontenegroMoroccoMozambiqueMyanmarNamibiaNepalNetherlandsNew CaledoniaNew ZealandNicaraguaNigerNigeriaNorth AmericaNorwayOECD membersOmanOther small statesPacific island small statesPakistanPanamaPapua New GuineaParaguayPeruPhilippinesPolandPortugalPost-demographic dividendPre-demographic dividendQatarRomaniaRussian FederationRwandaSamoaSao Tome and PrincipeSaudi ArabiaSenegalSerbiaSeychellesSierra LeoneSingaporeSlovak RepublicSloveniaSmall statesSolomon IslandsSomaliaSouth AfricaSouth AsiaSouth Asia (IDA & IBRD)South SudanSpainSri LankaSt. LuciaSt. Vincent and the GrenadinesSub-Saharan Africa Sub-Saharan Africa (excluding high income)Sub-Saharan Africa (IDA & IBRD countries)SudanSurinameSwazilandSwedenSwitzerlandSyrian Arab RepublicTajikistanTanzaniaThailandTimor-LesteTogoTongaTrinidad and TobagoTunisiaTurkeyTurkmenistanUgandaUkraineUnited Arab EmiratesUnited KingdomUnited StatesUpper middle incomeUruguayUzbekistanVanuatuVenezuela, RBVietnamWorldYemen, Rep.ZambiaZimbabwe Timeline:
This timeline shows a graph from 1971 to 2016 of Low income. No data until 1970. Number of actual observations by date: 46.
Source name:
World Development Indicators
Source organization:
Estimates based on sources and methods described in "The Changing Wealth of Nations: Measuring Sustainable Development in the New Millennium" (World Bank, 2011).
Categories, topics:
Environment
Last updated:
apr 23, 2017
Indicators value changes by year
Maximum:
14.417
jan 1, 1996
At the date of observation
Value
Absolute change
Change from previous value
jan 1, 1971
3.388
+3.388
0.0%
jan 1, 1972
2.867
-0.521
-15.37%
jan 1, 1973
2.872
+0.005
0.18%
jan 1, 1974
4.069
+1.196
41.65%
jan 1, 1975
3.839
-0.229
-5.64%
jan 1, 1976
4.525
+0.686
17.86%
jan 1, 1977
4.055
-0.47
-10.39%
jan 1, 1978
6.646
+2.591
63.89%
jan 1, 1979
6.306
-0.34
-5.11%
jan 1, 1980
5.198
-1.108
-17.57%
jan 1, 1981
5.953
+0.755
14.52%
jan 1, 1982
6.432
+0.479
8.04%
jan 1, 1983
9.374
+2.942
45.75%
jan 1, 1984
6.413
-2.961
-31.58%
jan 1, 1985
6.175
-0.238
-3.71%
jan 1, 1986
4.492
-1.684
-27.27%
jan 1, 1987
6.358
+1.867
41.56%
jan 1, 1988
5.934
-0.424
-6.67%
jan 1, 1989
6.228
+0.293
4.94%
jan 1, 1990
6.642
+0.414
6.64%
jan 1, 1991
7.722
+1.081
16.27%
jan 1, 1992
7.195
-0.527
-6.83%
jan 1, 1993
8.473
+1.279
17.77%
jan 1, 1994
7.5
-0.973
-11.48%
jan 1, 1995
11.053
+3.553
47.37%
jan 1, 1996
14.417
+3.364
30.43%
jan 1, 1997
12.962
-1.455
-10.09%
jan 1, 1998
11.75
-1.212
-9.35%
jan 1, 1999
12.156
+0.406
3.46%
jan 1, 2000
7.932
-4.224
-34.75%
jan 1, 2001
6.911
-1.021
-12.87%
jan 1, 2002
7.331
+0.419
6.07%
jan 1, 2003
8.254
+0.923
12.6%
jan 1, 2004
11.976
+3.722
45.09%
jan 1, 2005
9.227
-2.749
-22.95%
jan 1, 2006
8.338
-0.889
-9.63%
jan 1, 2007
7.747
-0.591
-7.08%
jan 1, 2008
9.446
+1.698
21.92%
jan 1, 2009
9.521
+0.075
0.8%
jan 1, 2010
9.061
-0.46
-4.83%
jan 1, 2011
7.621
-1.44
-15.89%
jan 1, 2012
7.385
-0.236
-3.1%
jan 1, 2013
7.876
+0.491
6.65%
jan 1, 2014
7.659
-0.217
-2.76%
jan 1, 2015
7.305
-0.354
-4.62%
jan 1, 2016
9.428
+2.123
29.07%
Ranking of countries by current statistics by years


Comments: