29
/
en
AIzaSyAYiBZKx7MnpbEhh9jyipgxe19OcubqV5w
April 1, 2024
25687
Central Europe and the Baltics
CEB
false
2
1
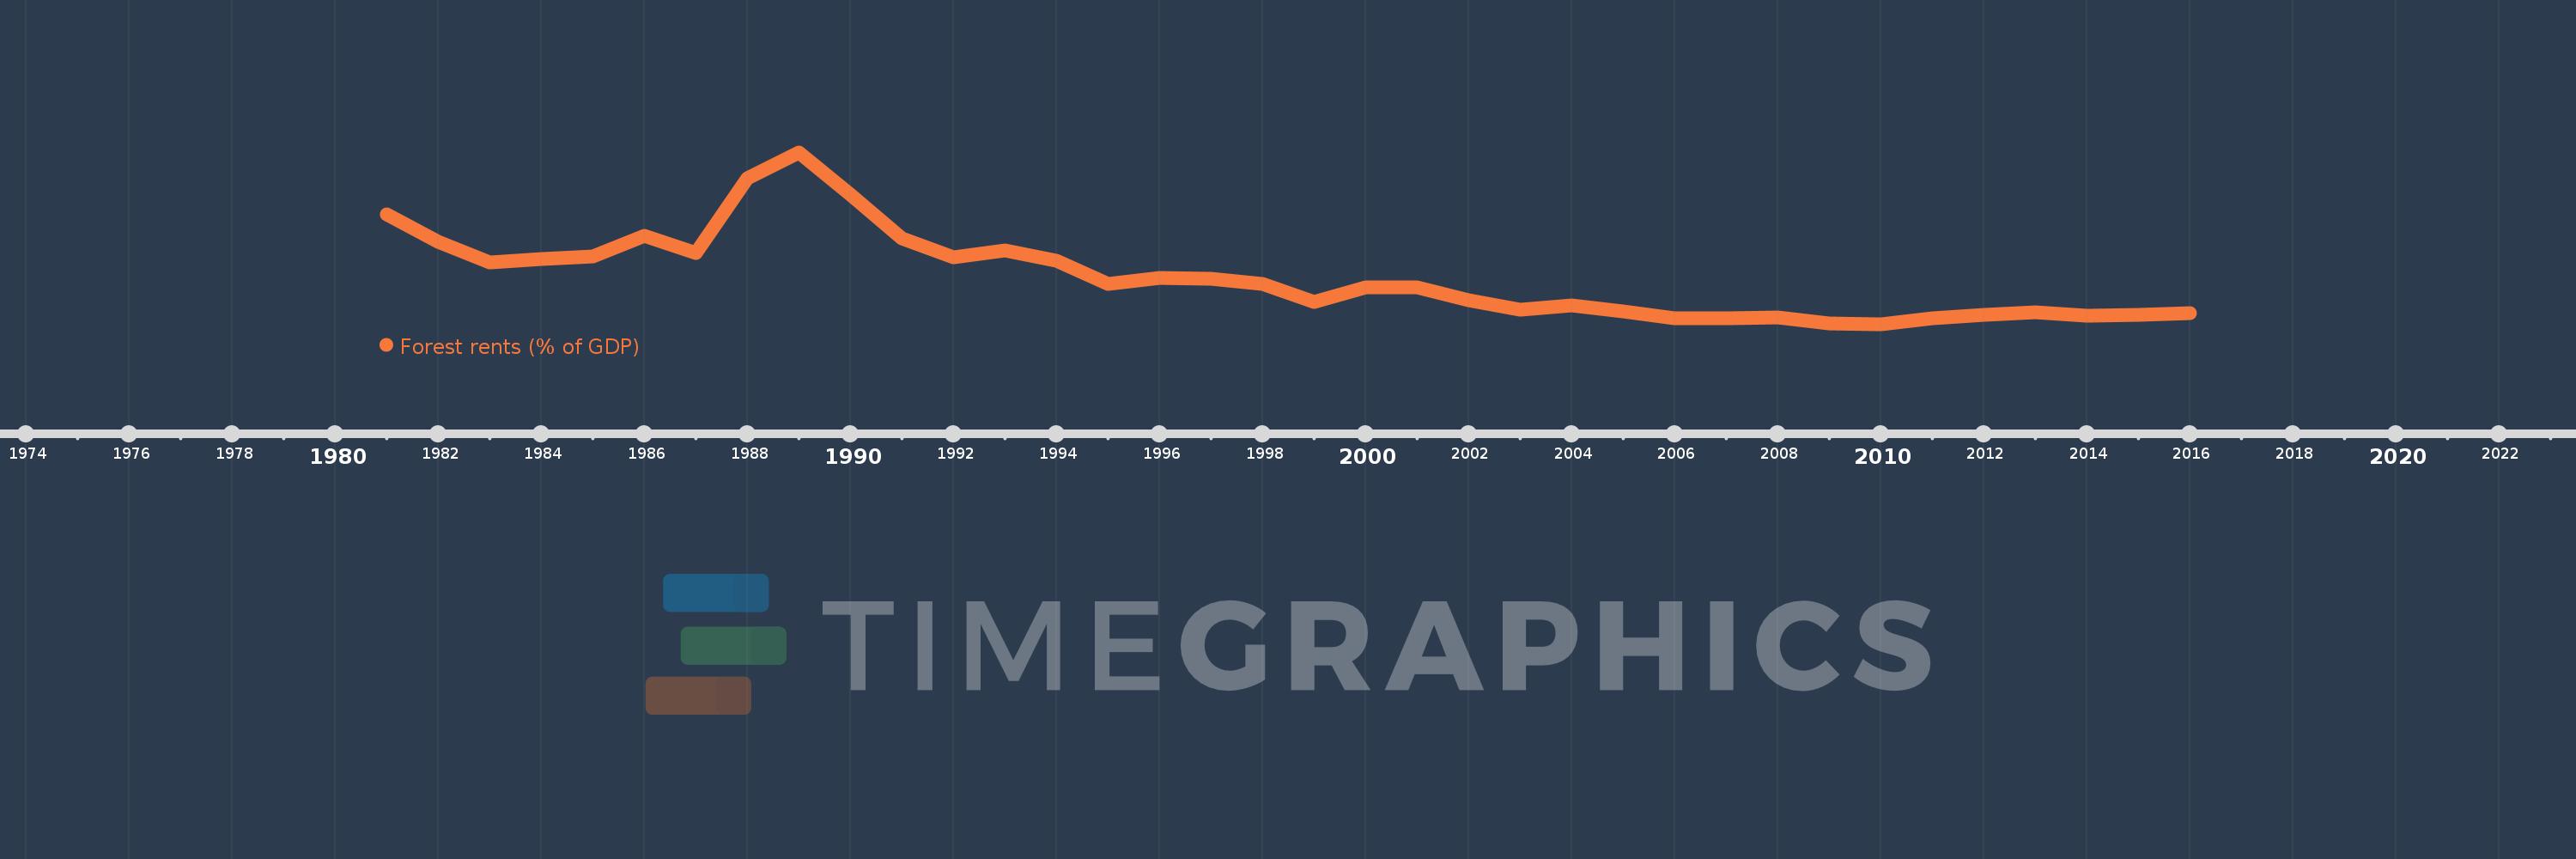
Forest rents (% of GDP)
2016,2015,2014,2013,2012,2011,2010,2009,2008,2007,2006,2005,2004,2003,2002,2001,2000,1999,1998,1997,1996,1995,1994,1993,1992,1991,1990,1989,1988,1987,1986,1985,1984,1983,1982,1981
This statistics in other country:
AfghanistanAlbaniaAlgeriaAndorraAngolaArab WorldArgentinaArmeniaArubaAustraliaAustriaAzerbaijanBahamas, TheBahrainBangladeshBarbadosBelarusBelgiumBelizeBeninBhutanBoliviaBosnia and HerzegovinaBotswanaBrazilBrunei DarussalamBulgariaBurkina FasoBurundiCabo VerdeCambodiaCameroonCanadaCaribbean small statesCentral African RepublicCentral Europe and the BalticsChadChileChinaColombiaComorosCongo, Dem. Rep.Congo, Rep.Costa RicaCote d'IvoireCroatiaCubaCyprusCzech RepublicDenmarkDjiboutiDominicaDominican RepublicEarly-demographic dividendEast Asia & PacificEast Asia & Pacific (excluding high income)East Asia & Pacific (IDA & IBRD countries)EcuadorEgypt, Arab Rep.El SalvadorEquatorial GuineaEritreaEstoniaEthiopiaEuro areaEurope & Central AsiaEurope & Central Asia (excluding high income)Europe & Central Asia (IDA & IBRD countries)European UnionFaroe IslandsFijiFinlandFragile and conflict affected situationsFranceFrench PolynesiaGabonGambia, TheGeorgiaGermanyGhanaGreeceGuatemalaGuineaGuinea-BissauGuyanaHaitiHeavily indebted poor countries (HIPC)High incomeHondurasHong Kong SAR, ChinaHungaryIBRD onlyIcelandIDA & IBRD totalIDA blendIDA onlyIDA totalIndiaIndonesiaIran, Islamic Rep.IraqIrelandIsraelItalyJamaicaJapanJordanKazakhstanKenyaKiribatiKorea, Rep.KuwaitKyrgyz RepublicLao PDRLate-demographic dividendLatin America & Caribbean Latin America & Caribbean (excluding high income)Latin America & the Caribbean (IDA & IBRD countries)LatviaLeast developed countries: UN classificationLebanonLesothoLiberiaLibyaLiechtensteinLithuaniaLow & middle incomeLow incomeLower middle incomeLuxembourgMacao SAR, ChinaMacedonia, FYRMadagascarMalawiMalaysiaMaldivesMaliMaltaMauritaniaMauritiusMexicoMicronesia, Fed. Sts.Middle East & North AfricaMiddle East & North Africa (excluding high income)Middle East & North Africa (IDA & IBRD countries)Middle incomeMoldovaMongoliaMontenegroMoroccoMozambiqueMyanmarNamibiaNepalNetherlandsNew CaledoniaNew ZealandNicaraguaNigerNigeriaNorth AmericaNorwayOECD membersOmanOther small statesPacific island small statesPakistanPanamaPapua New GuineaParaguayPeruPhilippinesPolandPortugalPost-demographic dividendPre-demographic dividendQatarRomaniaRussian FederationRwandaSamoaSao Tome and PrincipeSaudi ArabiaSenegalSerbiaSeychellesSierra LeoneSingaporeSlovak RepublicSloveniaSmall statesSolomon IslandsSomaliaSouth AfricaSouth AsiaSouth Asia (IDA & IBRD)South SudanSpainSri LankaSt. LuciaSt. Vincent and the GrenadinesSub-Saharan Africa Sub-Saharan Africa (excluding high income)Sub-Saharan Africa (IDA & IBRD countries)SudanSurinameSwazilandSwedenSwitzerlandSyrian Arab RepublicTajikistanTanzaniaThailandTimor-LesteTogoTongaTrinidad and TobagoTunisiaTurkeyTurkmenistanUgandaUkraineUnited Arab EmiratesUnited KingdomUnited StatesUpper middle incomeUruguayUzbekistanVanuatuVenezuela, RBVietnamWorldYemen, Rep.ZambiaZimbabwe Timeline:
This timeline shows a graph from 1981 to 2016 of Central Europe and the Baltics. No data until 1980. Number of actual observations by date: 36.
Source name:
World Development Indicators
Source organization:
Estimates based on sources and methods described in "The Changing Wealth of Nations: Measuring Sustainable Development in the New Millennium" (World Bank, 2011).
Categories, topics:
Environment
Last updated:
apr 23, 2017
Indicators value changes by year
At the date of observation
Value
Absolute change
Change from previous value
jan 1, 1981
0.67
+0.67
0.0%
jan 1, 1982
0.549
-0.121
-18.02%
jan 1, 1983
0.458
-0.091
-16.62%
jan 1, 1984
0.476
+0.018
3.91%
jan 1, 1985
0.485
+0.009
1.88%
jan 1, 1986
0.575
+0.09
18.47%
jan 1, 1987
0.5
-0.075
-12.97%
jan 1, 1988
0.83
+0.33
66.04%
jan 1, 1989
0.944
+0.113
13.65%
jan 1, 1990
0.758
-0.185
-19.62%
jan 1, 1991
0.564
-0.195
-25.68%
jan 1, 1992
0.48
-0.084
-14.92%
jan 1, 1993
0.513
+0.034
7.02%
jan 1, 1994
0.466
-0.047
-9.14%
jan 1, 1995
0.363
-0.103
-22.13%
jan 1, 1996
0.391
+0.028
7.72%
jan 1, 1997
0.389
-0.002
-0.44%
jan 1, 1998
0.363
-0.026
-6.77%
jan 1, 1999
0.285
-0.078
-21.44%
jan 1, 2000
0.348
+0.063
22.16%
jan 1, 2001
0.351
+0.002
0.7%
jan 1, 2002
0.292
-0.059
-16.83%
jan 1, 2003
0.25
-0.042
-14.35%
jan 1, 2004
0.268
+0.018
7.25%
jan 1, 2005
0.245
-0.023
-8.43%
jan 1, 2006
0.213
-0.032
-13.19%
jan 1, 2007
0.215
+0.002
1.03%
jan 1, 2008
0.216
+0.001
0.54%
jan 1, 2009
0.19
-0.027
-12.31%
jan 1, 2010
0.187
-0.002
-1.26%
jan 1, 2011
0.213
+0.026
13.64%
jan 1, 2012
0.228
+0.015
7.28%
jan 1, 2013
0.239
+0.01
4.52%
jan 1, 2014
0.226
-0.013
-5.27%
jan 1, 2015
0.23
+0.004
1.82%
jan 1, 2016
0.235
+0.005
2.24%
Ranking of countries by current statistics by years


Comments: