29
/
en
AIzaSyAYiBZKx7MnpbEhh9jyipgxe19OcubqV5w
April 1, 2024
34956
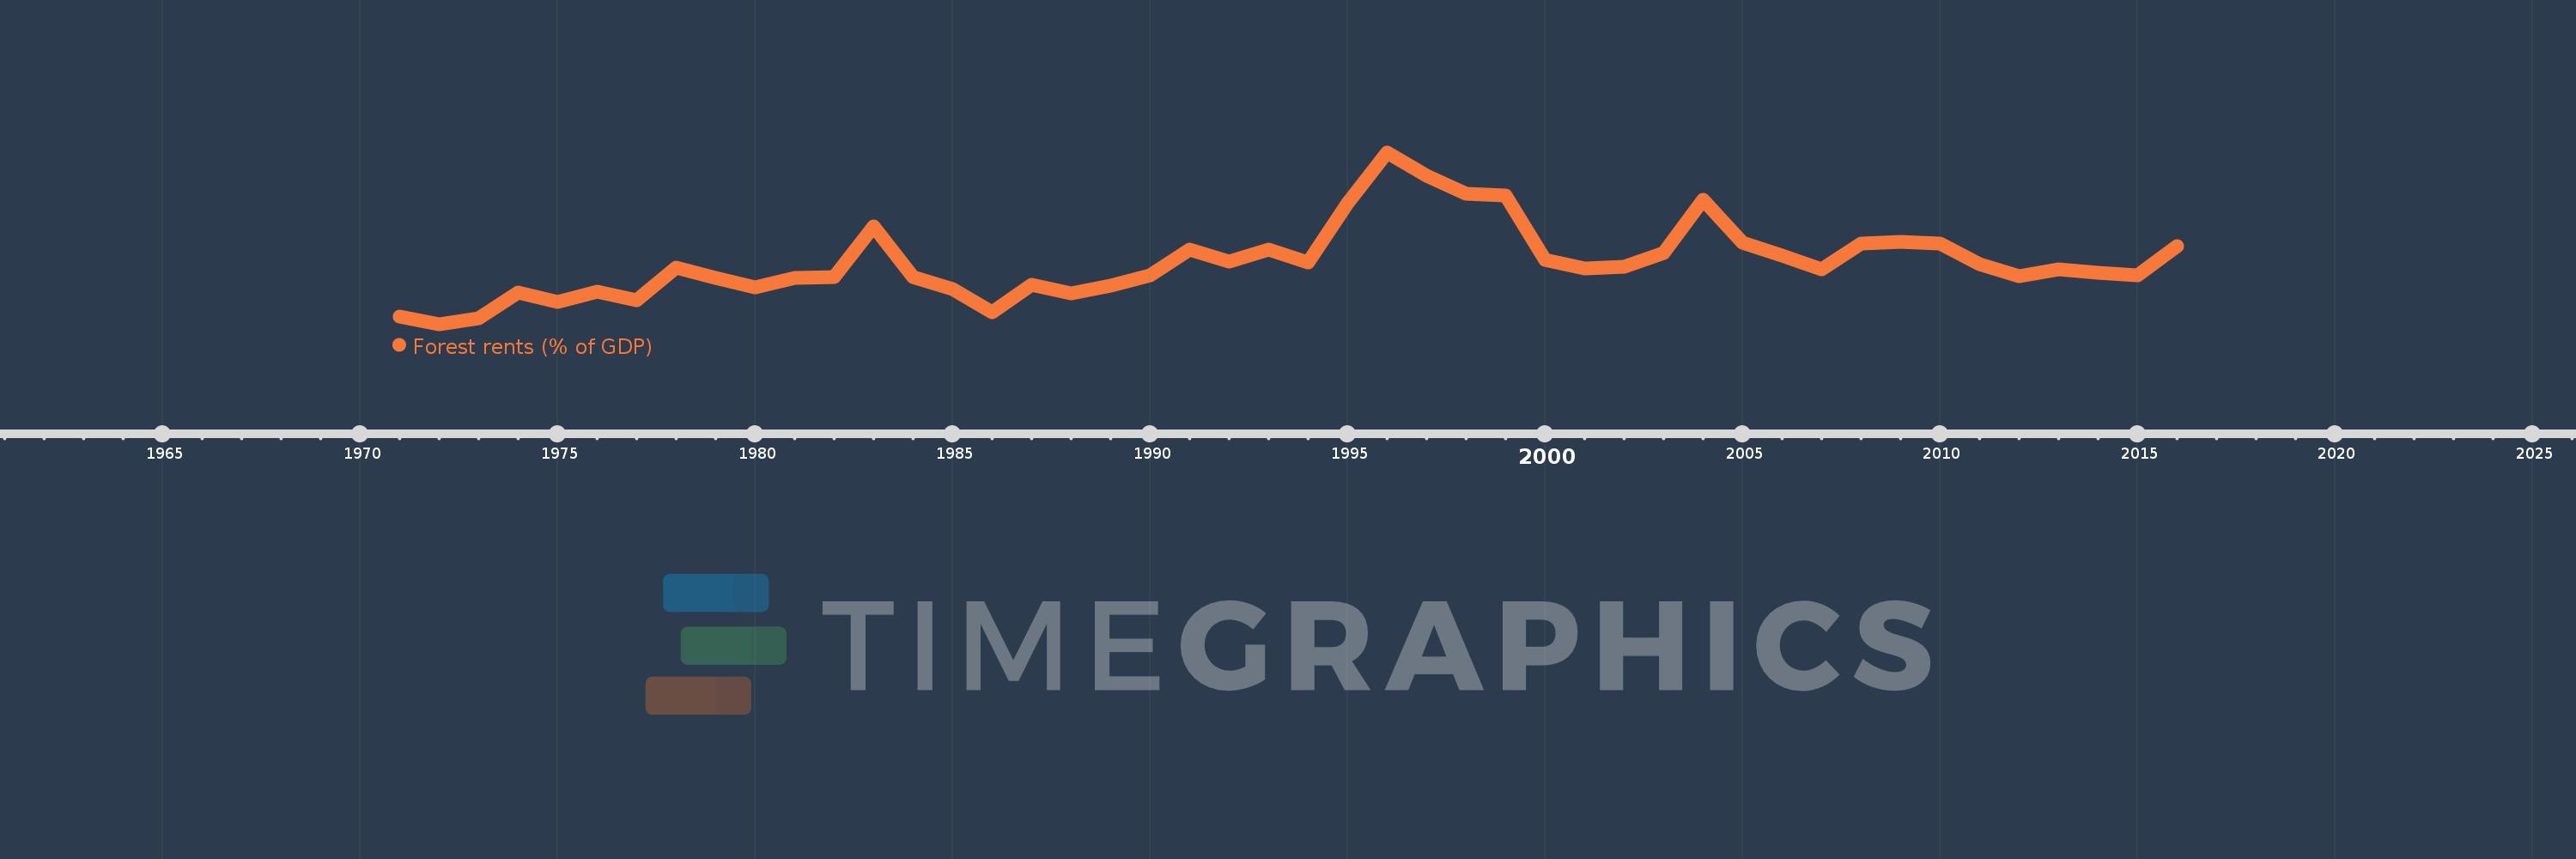
Heavily indebted poor countries (HIPC)
HPC
false
2
1
Forest rents (% of GDP)
2016,2015,2014,2013,2012,2011,2010,2009,2008,2007,2006,2005,2004,2003,2002,2001,2000,1999,1998,1997,1996,1995,1994,1993,1992,1991,1990,1989,1988,1987,1986,1985,1984,1983,1982,1981,1980,1979,1978,1977,1976,1975,1974,1973,1972,1971
This statistics in other country:
AfghanistanAlbaniaAlgeriaAndorraAngolaArab WorldArgentinaArmeniaArubaAustraliaAustriaAzerbaijanBahamas, TheBahrainBangladeshBarbadosBelarusBelgiumBelizeBeninBhutanBoliviaBosnia and HerzegovinaBotswanaBrazilBrunei DarussalamBulgariaBurkina FasoBurundiCabo VerdeCambodiaCameroonCanadaCaribbean small statesCentral African RepublicCentral Europe and the BalticsChadChileChinaColombiaComorosCongo, Dem. Rep.Congo, Rep.Costa RicaCote d'IvoireCroatiaCubaCyprusCzech RepublicDenmarkDjiboutiDominicaDominican RepublicEarly-demographic dividendEast Asia & PacificEast Asia & Pacific (excluding high income)East Asia & Pacific (IDA & IBRD countries)EcuadorEgypt, Arab Rep.El SalvadorEquatorial GuineaEritreaEstoniaEthiopiaEuro areaEurope & Central AsiaEurope & Central Asia (excluding high income)Europe & Central Asia (IDA & IBRD countries)European UnionFaroe IslandsFijiFinlandFragile and conflict affected situationsFranceFrench PolynesiaGabonGambia, TheGeorgiaGermanyGhanaGreeceGuatemalaGuineaGuinea-BissauGuyanaHaitiHeavily indebted poor countries (HIPC)High incomeHondurasHong Kong SAR, ChinaHungaryIBRD onlyIcelandIDA & IBRD totalIDA blendIDA onlyIDA totalIndiaIndonesiaIran, Islamic Rep.IraqIrelandIsraelItalyJamaicaJapanJordanKazakhstanKenyaKiribatiKorea, Rep.KuwaitKyrgyz RepublicLao PDRLate-demographic dividendLatin America & Caribbean Latin America & Caribbean (excluding high income)Latin America & the Caribbean (IDA & IBRD countries)LatviaLeast developed countries: UN classificationLebanonLesothoLiberiaLibyaLiechtensteinLithuaniaLow & middle incomeLow incomeLower middle incomeLuxembourgMacao SAR, ChinaMacedonia, FYRMadagascarMalawiMalaysiaMaldivesMaliMaltaMauritaniaMauritiusMexicoMicronesia, Fed. Sts.Middle East & North AfricaMiddle East & North Africa (excluding high income)Middle East & North Africa (IDA & IBRD countries)Middle incomeMoldovaMongoliaMontenegroMoroccoMozambiqueMyanmarNamibiaNepalNetherlandsNew CaledoniaNew ZealandNicaraguaNigerNigeriaNorth AmericaNorwayOECD membersOmanOther small statesPacific island small statesPakistanPanamaPapua New GuineaParaguayPeruPhilippinesPolandPortugalPost-demographic dividendPre-demographic dividendQatarRomaniaRussian FederationRwandaSamoaSao Tome and PrincipeSaudi ArabiaSenegalSerbiaSeychellesSierra LeoneSingaporeSlovak RepublicSloveniaSmall statesSolomon IslandsSomaliaSouth AfricaSouth AsiaSouth Asia (IDA & IBRD)South SudanSpainSri LankaSt. LuciaSt. Vincent and the GrenadinesSub-Saharan Africa Sub-Saharan Africa (excluding high income)Sub-Saharan Africa (IDA & IBRD countries)SudanSurinameSwazilandSwedenSwitzerlandSyrian Arab RepublicTajikistanTanzaniaThailandTimor-LesteTogoTongaTrinidad and TobagoTunisiaTurkeyTurkmenistanUgandaUkraineUnited Arab EmiratesUnited KingdomUnited StatesUpper middle incomeUruguayUzbekistanVanuatuVenezuela, RBVietnamWorldYemen, Rep.ZambiaZimbabwe Timeline:
This timeline shows a graph from 1971 to 2016 of Heavily indebted poor countries (HIPC). No data until 1970. Number of actual observations by date: 46.
Source name:
World Development Indicators
Source organization:
Estimates based on sources and methods described in "The Changing Wealth of Nations: Measuring Sustainable Development in the New Millennium" (World Bank, 2011).
Categories, topics:
Environment
Last updated:
apr 23, 2017
Indicators value changes by year
Maximum:
11.683
jan 1, 1996
At the date of observation
Value
Absolute change
Change from previous value
jan 1, 1971
3.483
+3.483
0.0%
jan 1, 1972
3.092
-0.391
-11.23%
jan 1, 1973
3.408
+0.316
10.22%
jan 1, 1974
4.677
+1.269
37.24%
jan 1, 1975
4.197
-0.481
-10.27%
jan 1, 1976
4.706
+0.51
12.15%
jan 1, 1977
4.304
-0.403
-8.55%
jan 1, 1978
5.938
+1.635
37.99%
jan 1, 1979
5.405
-0.533
-8.98%
jan 1, 1980
4.951
-0.454
-8.4%
jan 1, 1981
5.424
+0.473
9.55%
jan 1, 1982
5.457
+0.034
0.62%
jan 1, 1983
7.973
+2.515
46.09%
jan 1, 1984
5.463
-2.509
-31.48%
jan 1, 1985
4.84
-0.624
-11.42%
jan 1, 1986
3.669
-1.171
-24.19%
jan 1, 1987
5.071
+1.403
38.23%
jan 1, 1988
4.638
-0.434
-8.55%
jan 1, 1989
5.0
+0.362
7.8%
jan 1, 1990
5.525
+0.526
10.51%
jan 1, 1991
6.845
+1.32
23.88%
jan 1, 1992
6.205
-0.639
-9.34%
jan 1, 1993
6.844
+0.638
10.29%
jan 1, 1994
6.163
-0.681
-9.95%
jan 1, 1995
9.142
+2.98
48.35%
jan 1, 1996
11.683
+2.54
27.79%
jan 1, 1997
10.526
-1.157
-9.91%
jan 1, 1998
9.604
-0.921
-8.75%
jan 1, 1999
9.552
-0.052
-0.55%
jan 1, 2000
6.321
-3.231
-33.83%
jan 1, 2001
5.882
-0.439
-6.95%
jan 1, 2002
5.975
+0.093
1.58%
jan 1, 2003
6.66
+0.685
11.47%
jan 1, 2004
9.295
+2.635
39.56%
jan 1, 2005
7.158
-2.137
-23.0%
jan 1, 2006
6.543
-0.615
-8.59%
jan 1, 2007
5.842
-0.7
-10.7%
jan 1, 2008
7.134
+1.291
22.1%
jan 1, 2009
7.193
+0.06
0.84%
jan 1, 2010
7.143
-0.051
-0.7%
jan 1, 2011
6.102
-1.04
-14.57%
jan 1, 2012
5.491
-0.611
-10.01%
jan 1, 2013
5.83
+0.338
6.16%
jan 1, 2014
5.686
-0.144
-2.47%
jan 1, 2015
5.55
-0.136
-2.39%
jan 1, 2016
7.015
+1.465
26.4%
Ranking of countries by current statistics by years


Comments: