29
/
en
AIzaSyAYiBZKx7MnpbEhh9jyipgxe19OcubqV5w
April 1, 2024
205253
Namibia
NAM
true
2
1
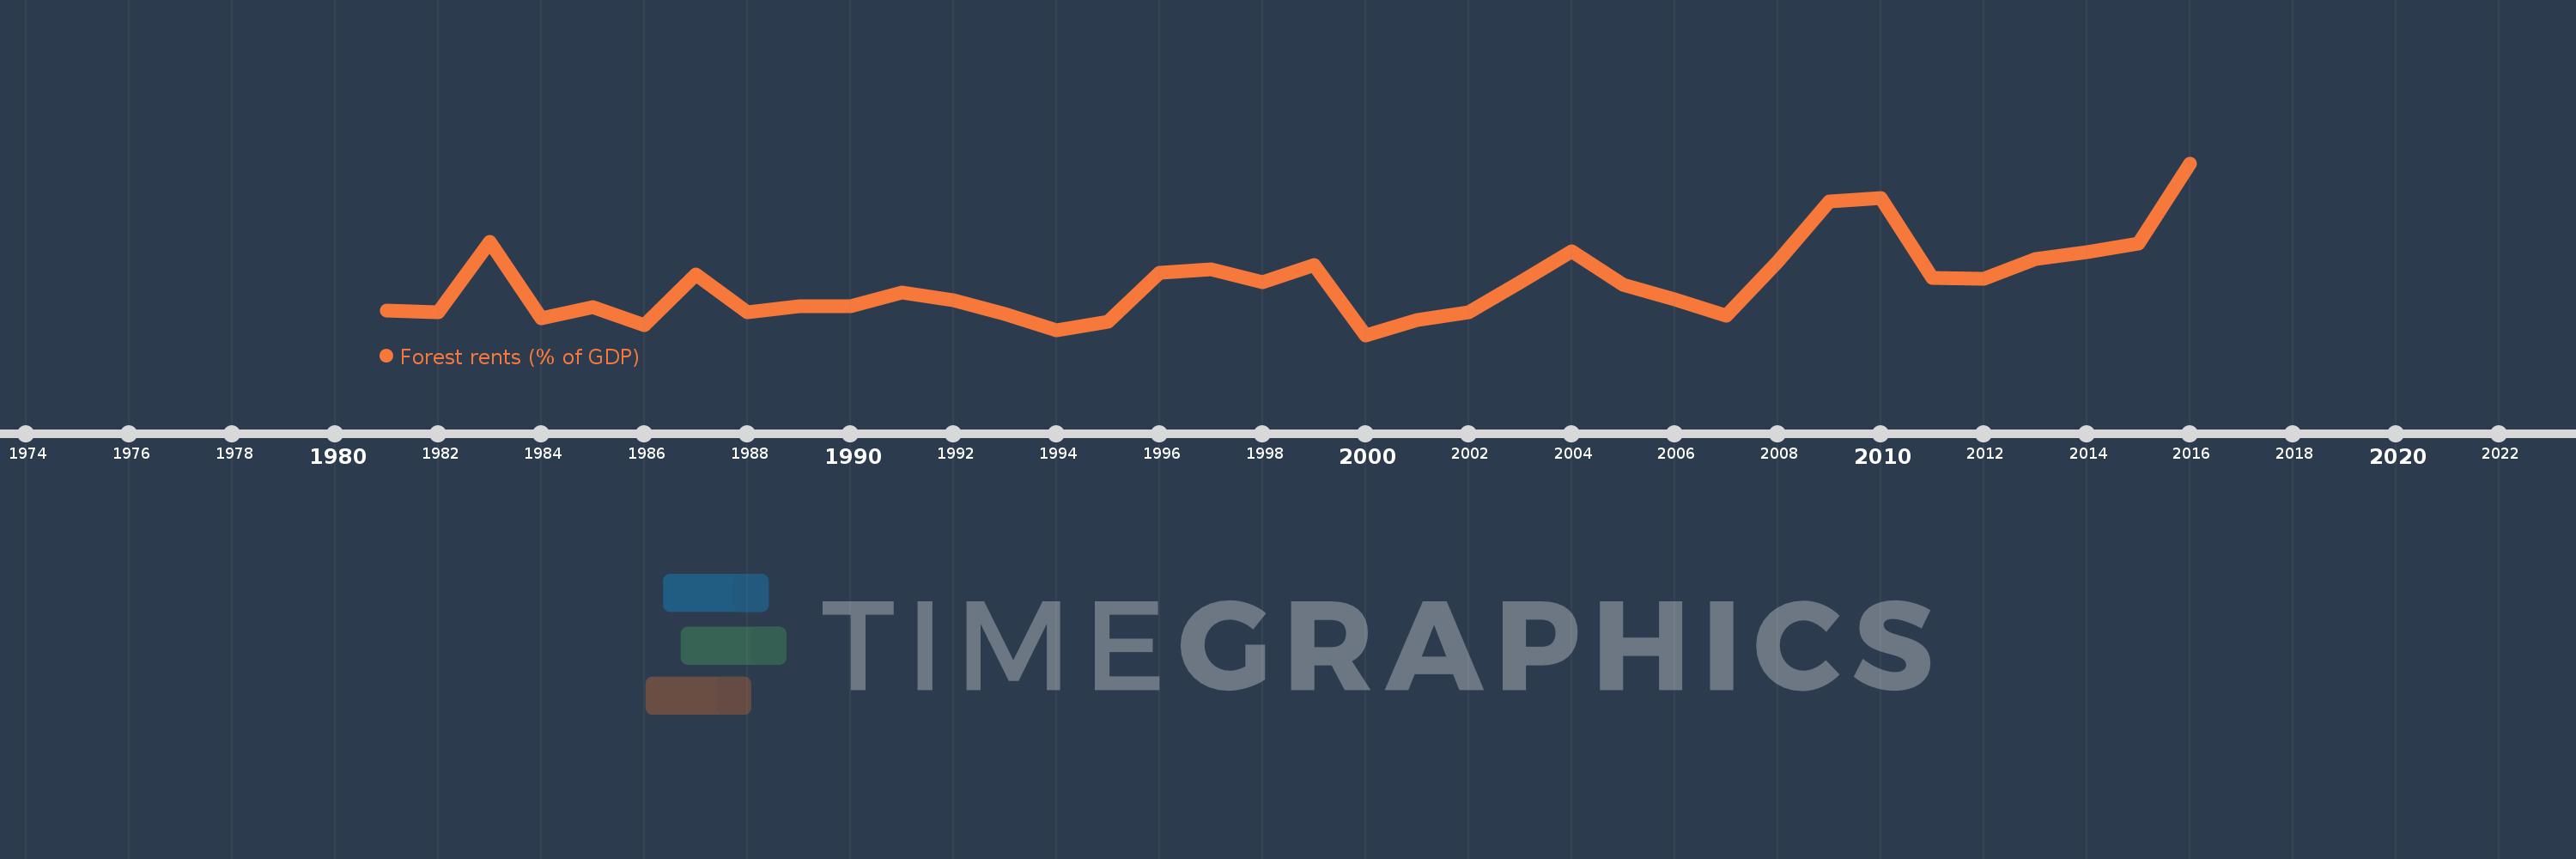
Forest rents (% of GDP)
2016,2015,2014,2013,2012,2011,2010,2009,2008,2007,2006,2005,2004,2003,2002,2001,2000,1999,1998,1997,1996,1995,1994,1993,1992,1991,1990,1989,1988,1987,1986,1985,1984,1983,1982,1981
This statistics in other country:
AfghanistanAlbaniaAlgeriaAndorraAngolaArab WorldArgentinaArmeniaArubaAustraliaAustriaAzerbaijanBahamas, TheBahrainBangladeshBarbadosBelarusBelgiumBelizeBeninBhutanBoliviaBosnia and HerzegovinaBotswanaBrazilBrunei DarussalamBulgariaBurkina FasoBurundiCabo VerdeCambodiaCameroonCanadaCaribbean small statesCentral African RepublicCentral Europe and the BalticsChadChileChinaColombiaComorosCongo, Dem. Rep.Congo, Rep.Costa RicaCote d'IvoireCroatiaCubaCyprusCzech RepublicDenmarkDjiboutiDominicaDominican RepublicEarly-demographic dividendEast Asia & PacificEast Asia & Pacific (excluding high income)East Asia & Pacific (IDA & IBRD countries)EcuadorEgypt, Arab Rep.El SalvadorEquatorial GuineaEritreaEstoniaEthiopiaEuro areaEurope & Central AsiaEurope & Central Asia (excluding high income)Europe & Central Asia (IDA & IBRD countries)European UnionFaroe IslandsFijiFinlandFragile and conflict affected situationsFranceFrench PolynesiaGabonGambia, TheGeorgiaGermanyGhanaGreeceGuatemalaGuineaGuinea-BissauGuyanaHaitiHeavily indebted poor countries (HIPC)High incomeHondurasHong Kong SAR, ChinaHungaryIBRD onlyIcelandIDA & IBRD totalIDA blendIDA onlyIDA totalIndiaIndonesiaIran, Islamic Rep.IraqIrelandIsraelItalyJamaicaJapanJordanKazakhstanKenyaKiribatiKorea, Rep.KuwaitKyrgyz RepublicLao PDRLate-demographic dividendLatin America & Caribbean Latin America & Caribbean (excluding high income)Latin America & the Caribbean (IDA & IBRD countries)LatviaLeast developed countries: UN classificationLebanonLesothoLiberiaLibyaLiechtensteinLithuaniaLow & middle incomeLow incomeLower middle incomeLuxembourgMacao SAR, ChinaMacedonia, FYRMadagascarMalawiMalaysiaMaldivesMaliMaltaMauritaniaMauritiusMexicoMicronesia, Fed. Sts.Middle East & North AfricaMiddle East & North Africa (excluding high income)Middle East & North Africa (IDA & IBRD countries)Middle incomeMoldovaMongoliaMontenegroMoroccoMozambiqueMyanmarNamibiaNepalNetherlandsNew CaledoniaNew ZealandNicaraguaNigerNigeriaNorth AmericaNorwayOECD membersOmanOther small statesPacific island small statesPakistanPanamaPapua New GuineaParaguayPeruPhilippinesPolandPortugalPost-demographic dividendPre-demographic dividendQatarRomaniaRussian FederationRwandaSamoaSao Tome and PrincipeSaudi ArabiaSenegalSerbiaSeychellesSierra LeoneSingaporeSlovak RepublicSloveniaSmall statesSolomon IslandsSomaliaSouth AfricaSouth AsiaSouth Asia (IDA & IBRD)South SudanSpainSri LankaSt. LuciaSt. Vincent and the GrenadinesSub-Saharan Africa Sub-Saharan Africa (excluding high income)Sub-Saharan Africa (IDA & IBRD countries)SudanSurinameSwazilandSwedenSwitzerlandSyrian Arab RepublicTajikistanTanzaniaThailandTimor-LesteTogoTongaTrinidad and TobagoTunisiaTurkeyTurkmenistanUgandaUkraineUnited Arab EmiratesUnited KingdomUnited StatesUpper middle incomeUruguayUzbekistanVanuatuVenezuela, RBVietnamWorldYemen, Rep.ZambiaZimbabwe Timeline:
This timeline shows a graph from 1981 to 2016 of Namibia. No data until 1980. Number of actual observations by date: 36.
Source name:
World Development Indicators
Source organization:
Estimates based on sources and methods described in "The Changing Wealth of Nations: Measuring Sustainable Development in the New Millennium" (World Bank, 2011).
Categories, topics:
Environment
Last updated:
apr 23, 2017
Indicators value changes by year
At the date of observation
Value
Absolute change
Change from previous value
jan 1, 1981
0.389
+0.389
0.0%
jan 1, 1982
0.384
-0.005
-1.35%
jan 1, 1983
0.61
+0.226
58.86%
jan 1, 1984
0.362
-0.248
-40.71%
jan 1, 1985
0.398
+0.036
9.96%
jan 1, 1986
0.342
-0.055
-13.95%
jan 1, 1987
0.506
+0.164
47.94%
jan 1, 1988
0.384
-0.122
-24.09%
jan 1, 1989
0.401
+0.017
4.32%
jan 1, 1990
0.403
+0.002
0.45%
jan 1, 1991
0.446
+0.043
10.7%
jan 1, 1992
0.422
-0.023
-5.22%
jan 1, 1993
0.376
-0.046
-10.97%
jan 1, 1994
0.323
-0.054
-14.24%
jan 1, 1995
0.353
+0.031
9.5%
jan 1, 1996
0.511
+0.158
44.72%
jan 1, 1997
0.523
+0.012
2.31%
jan 1, 1998
0.481
-0.042
-8.1%
jan 1, 1999
0.536
+0.056
11.6%
jan 1, 2000
0.309
-0.228
-42.43%
jan 1, 2001
0.358
+0.049
15.81%
jan 1, 2002
0.384
+0.026
7.29%
jan 1, 2003
0.479
+0.095
24.84%
jan 1, 2004
0.58
+0.101
21.08%
jan 1, 2005
0.473
-0.107
-18.49%
jan 1, 2006
0.423
-0.05
-10.54%
jan 1, 2007
0.371
-0.052
-12.31%
jan 1, 2008
0.548
+0.177
47.87%
jan 1, 2009
0.74
+0.191
34.89%
jan 1, 2010
0.753
+0.014
1.88%
jan 1, 2011
0.495
-0.259
-34.35%
jan 1, 2012
0.491
-0.004
-0.77%
jan 1, 2013
0.556
+0.065
13.21%
jan 1, 2014
0.577
+0.021
3.82%
jan 1, 2015
0.605
+0.028
4.84%
jan 1, 2016
0.865
+0.26
43.03%
Ranking of countries by current statistics by years


Comments: